South Maui Vacation Rentals in 2026 by the Numbers
The state counted 137,414 vacation rental unit nights in Wailea/Kīhei in August 2026 and found 42.8% of them sold. A four-condo host in North Kīhei gives the scale; state, county and university figures give the market.
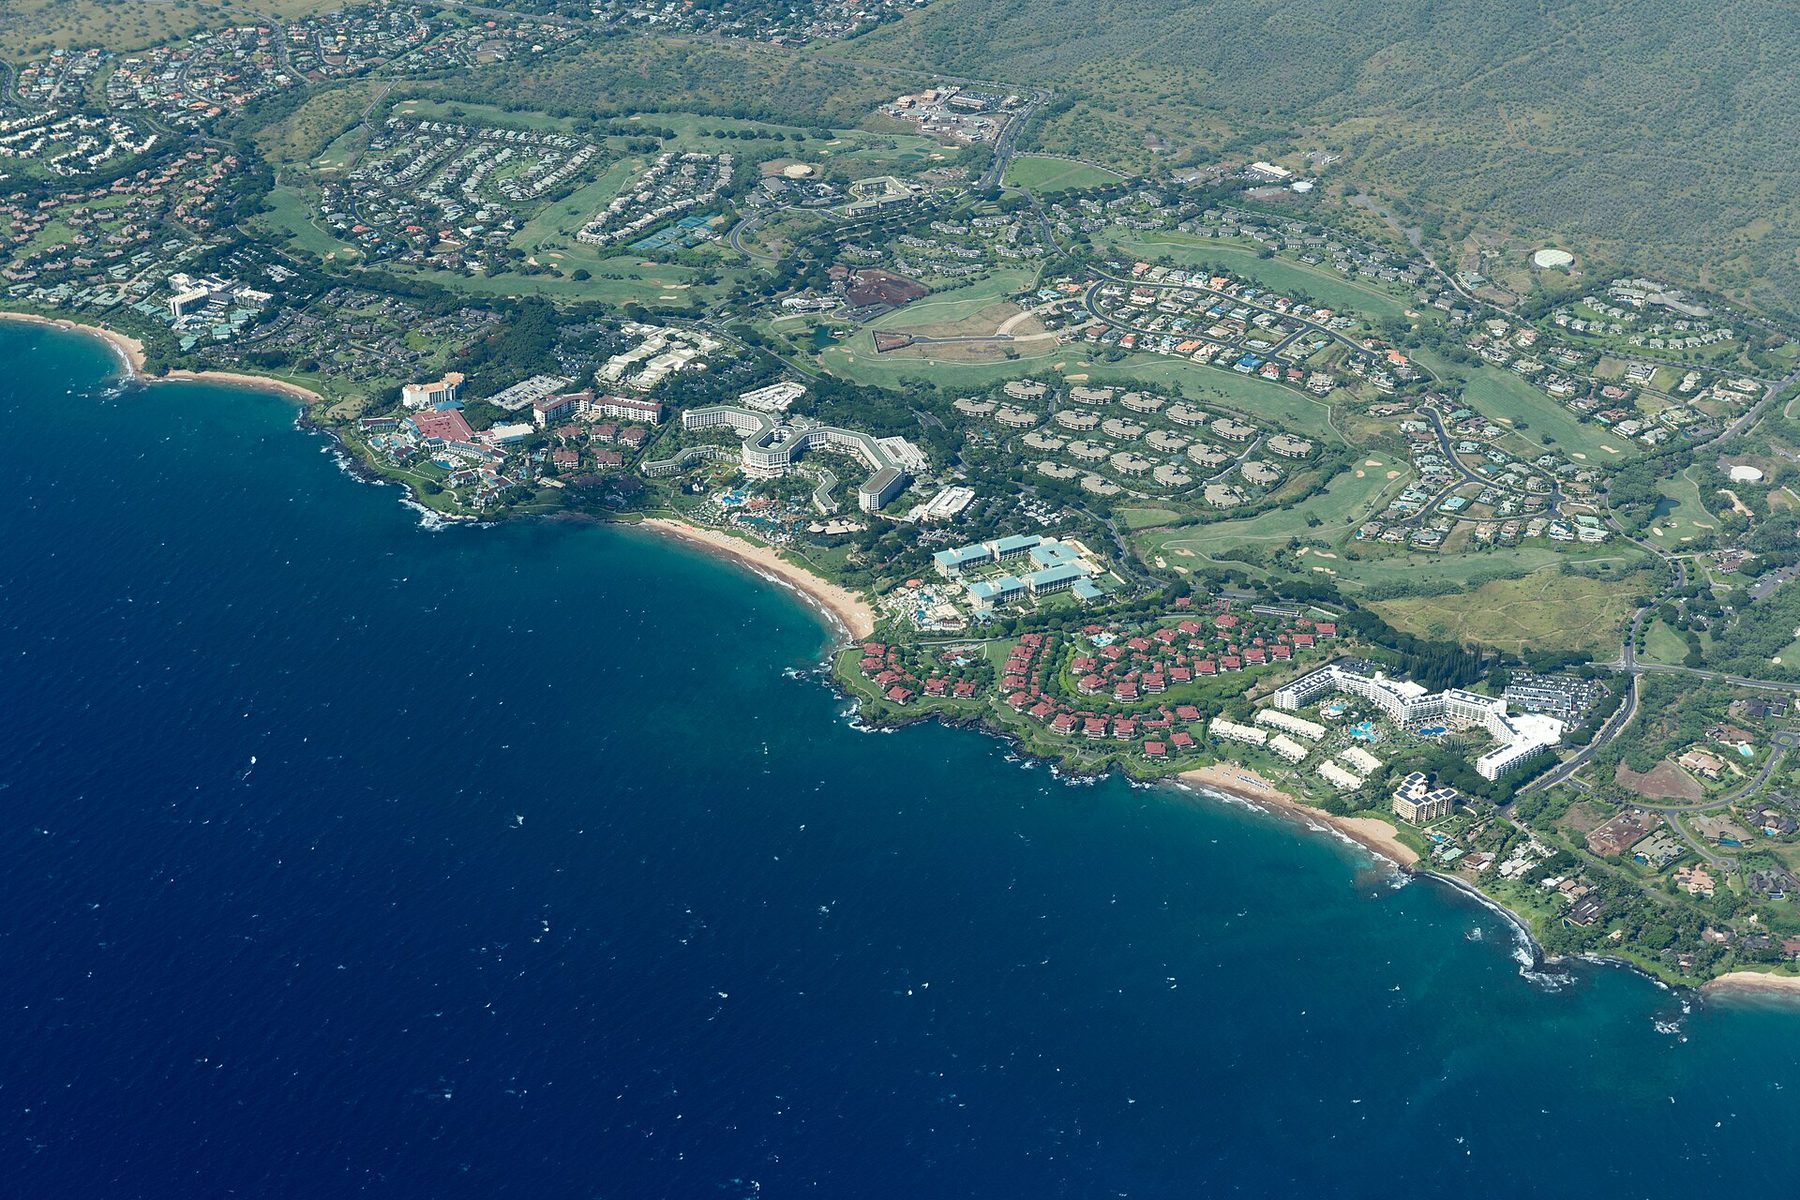
Wailea, HI by Ekrem Canli, CC BY-SA 4.0, via Wikimedia Commons (resized)
In August 2026 the State of Hawai’i counted 137,414 vacation rental unit nights on offer in Wailea/Kīhei, its reporting area for the south shore of Maui. Guests paid for 58,788 of them. That is an occupancy of 42.8%, at an average daily rate of $438.48, according to the August 2026 Hawai’i Vacation Rental Performance Report from the Department of Business, Economic Development and Tourism (DBEDT), which draws on data from Lighthouse Intelligence.
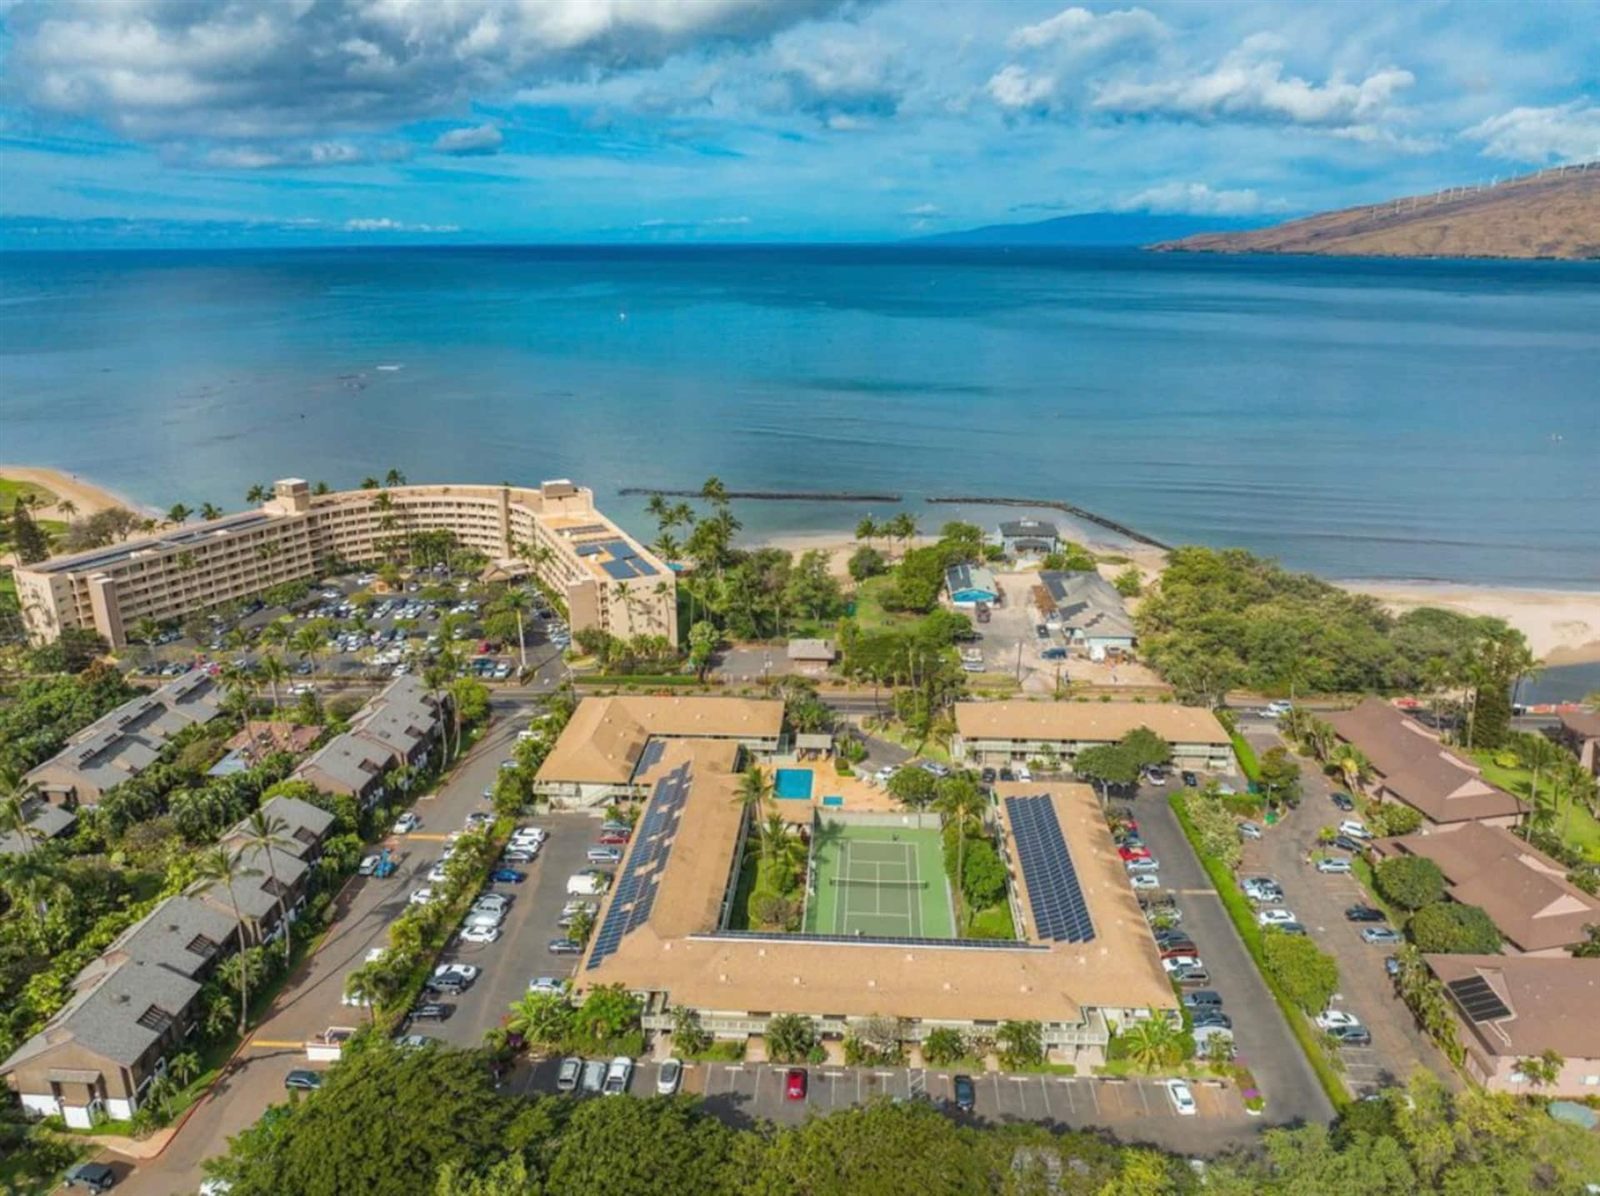
A unit night is one rental unit available for one night. To give the number a size, a host with four condos open every night of a 31-day month accounts for at most 124 of them. Maui Beachside Bungalows is a host of that size. It has four condos, three with two bedrooms and one studio, split between two low-rise condominium properties in North Kīhei, across South Kīhei Road from the beach. The hosts are Megan and Bryan. They give 2012 as the year they began hosting in Kīhei and say they live five minutes away.
This report uses that business as a unit of scale and as a worked example of how one small South Maui host is set up. No figure for its rates, its occupancy or its revenue is public, and none is given or implied here. Every market number comes from the state, the county, the University of Hawai’i or a named news report, with the month it describes.
Wailea/Kīhei in August and in the year to date
For the first eight months of 2026, DBEDT puts Wailea/Kīhei at 1,005,658 available unit nights and 526,042 sold: an occupancy of 52.3% at an average daily rate of $482.89. Supply was up 4.8% on the same months of 2025, demand up 5.0% and the rate up 2.3%.
August was weaker than the year. Occupancy of 42.8% was 9.5 points below the year-to-date figure. Against August 2025, supply was down 1.0%, demand down 2.3% and occupancy down half a point, while the rate rose 7.5%. Fewer nights were sold, at a higher price each.
The area is a large part of a large market. DBEDT's table gives Maui County 317,643 unit nights in August, the largest supply of any county, with 139,644 sold, a flat 44.0% occupancy and a rate of $648.94, up 24.1%. Statewide there were 899,523 unit nights, down 5.8%, at 46.8% occupancy and $527.78, up 17.4%. By our arithmetic from that table, Wailea/Kīhei supplied about 43% of the county's unit nights and the county about 35% of the state's.
US dollars per sold unit night
Average daily rate, AugustAverage daily rate, January to August
| Area | Supply, August (unit nights) | Occupancy, August | Average daily rate, August | Supply, January to August (unit nights) | Occupancy, January to August | Average daily rate, January to August |
|---|---|---|---|---|---|---|
| State of Hawai’i | 899,523 | 46.8% | $527.78 | 7,036,957 | 53.0% | $521.96 |
| Maui County | 317,643 | 44.0% | $648.94 | 2,320,533 | 52.2% | $646.31 |
| Wailea/Kīhei | 137,414 | 42.8% | $438.48 | 1,005,658 | 52.3% | $482.89 |
| Lahaina/Kā’anapali/Nāpili/Kapalua | 152,715 | 46.4% | $858.33 | 1,093,254 | 53.4% | $832.75 |
Rates are DBEDT's Total Rate, which includes cleaning and service fees. They are area averages, not the price of any one rental.
Source: Hawai’i DBEDT, August 2026 Hawai’i Vacation Rental Performance Report (Lighthouse Intelligence data)
The rate column needs two notes. DBEDT says its prices use a Total Rate, “a single price that includes all additional fees and costs (such as cleaning or service fees)”. It is an average across every sold night in an area and cannot be read as the price of any one condo, including the four used here for scale. The report covers listings on Airbnb, Booking.com, Vrbo and TripAdvisor, and DBEDT says the reservation-system data behind it covers “31.5 percent of Maui County”.
Multiplying rate by occupancy gives a rough revenue per available unit night: about $188 in Wailea/Kīhei in August and about $253 for the year to date. Those two numbers are our arithmetic and are not in the state's table.
South Maui against West Maui
West Maui's vacation rentals averaged $858.33 a night in August 2026, DBEDT reports, against $438.48 in Wailea/Kīhei: a difference of $419.85. The West Maui area in the report is Lahaina/Kā’anapali/Nāpili/Kapalua. Its rate was up 29.9% on August 2025. South Maui's was up 7.5%.
Occupancy does not explain the gap. West Maui sold 46.4% of its unit nights in August and Wailea/Kīhei 42.8%. Over the first eight months the two were 1.1 points apart, at 53.4% and 52.3%. What differs is the price of a sold night, and with it the revenue per available unit night, which by our arithmetic was just under $400 in West Maui in August, a little more than twice the South Maui figure.
Supply moved in opposite directions. West Maui had 152,715 unit nights in August, up 13.3%, and sold 70,911, up 12.7%. Wailea/Kīhei had 137,414, down 1.0%. For the year to date West Maui's supply was up 15.3%, its demand up 18.5% and its rate up 14.3% to $832.75.
The report does not say why West Maui's supply grew, and it carries two cautions. In July 2026 Lighthouse changed the way it removes duplicate listings, and DBEDT says the history has been restated: “Any shifts in supply figures reflect greater precision in the data, not changes in the market itself.” Monthly reports issued earlier in 2026 used the old method, so this article does not string them into a series with August.
The second caution is about what a unit is. DBEDT notes that “unlike hotels, units in vacation rentals are not necessarily available year-round”, and that “This report does not determine or differentiate between units that are permitted or unpermitted.” An average rate is also blind to the mix behind it. The table does not show how many sold nights were in studios, condos or large houses, and a change in that mix moves the average without any owner changing a price.
Vacation rentals against hotels
Wailea's hotels ran at 73.6% occupancy in August 2026 with an average daily rate of $733.54, according to DBEDT's August 2026 Hawai’i Hotel Performance Report, which uses data from STR. Occupancy was up 3.8 points on August 2025 and the rate up 4.4%. Revenue per available room, the hotel trade's RevPAR, was $540.08, up 10.0%.
Set beside the rental table, Wailea's hotels filled 30.8 points more of their rooms than Wailea/Kīhei's rentals filled of their unit nights, and took $295.06 more per sold night. The two measures are built differently and belong side by side, never as like for like. The hotel figure is a room rate for Wailea alone. The rental figure is a total rate, fees included, for whole units in Wailea and Kīhei together.
Maui County's hotels as a whole ran at 62.4% in August, up 0.3 points, at $525.74, up 5.0%. The luxury class reached 66.0% at $935.05. DBEDT's summary reads: “Maui County hotels continued to be impacted by the August 8, 2023, wildfires but still led the counties in August 2026 RevPAR due to comparatively higher ADR.” For the year to date the county's hotels were at 69.9% occupancy, up 5.6 points, with the rate down 0.6% to $547.54.
Percent of available unit nights or room nights sold
| Series | Area in the report | Occupancy | Average daily rate |
|---|---|---|---|
| South Maui rentals | Wailea/Kīhei | 42.8% | $438.48 |
| West Maui rentals | Lahaina/Kā’anapali/Nāpili/Kapalua | 46.4% | $858.33 |
| County rentals | Maui County | 44.0% | $648.94 |
| Wailea hotels | Wailea | 73.6% | $733.54 |
| West Maui hotels | Lahaina/Kā’anapali/Kapalua | 60.8% | $409.62 |
| County hotels | Maui County | 62.4% | $525.74 |
| Luxury hotels | Maui County, luxury class | 66.0% | $935.05 |
Rental rates are total rates per unit, fees included; hotel rates are room rates. The areas differ. Read side by side, not as like for like.
Source: Hawai’i DBEDT, August 2026 Vacation Rental Performance Report (Lighthouse Intelligence data) and August 2026 Hotel Performance Report (STR data)
The west side shows the two sectors pointing in opposite directions. Hotels in Lahaina/Kā’anapali/Kapalua ran at 60.8% at $409.62, well below Wailea's hotel rate, while West Maui's rentals were priced far above South Maui's. In South Maui it is the reverse. The reports give no reason, and the areas do not match exactly.
One limit of the state's geography matters to any Kīhei host. The rental table reports Wailea and Kīhei as one area with one average, while the hotel table reports Wailea alone. Whatever gap exists between rentals in the resort area and rentals in the town is inside the $438.48, and the state's figures cannot show it.
Visitors and what they spent
From January to August 2026 Maui counted 1,819,840 visitors, 6.0% more than the 1,716,286 of a year earlier, and their spending came to $4.30 billion, up 8.1% from $3.97 billion. The figures are from DBEDT's news release of 30 September 2026 on the August visitor statistics.
The make-up of that growth matters to anyone selling nights. The average stay on Maui shortened to 7.02 days for the year to date, from 7.85 a year earlier, while spending per person per day rose 14.1% to $336.40. A shorter stay means fewer nights sold per arrival, so arrivals can rise faster than demand for rooms and units. Over the same months rental demand rose 5.0% in Wailea/Kīhei.
| Measure | August 2026 | Against August 2025 | January to August 2026 | Against January to August 2025 |
|---|---|---|---|---|
| Visitors | 201,789 | -5.5% | 1,819,840 | +6.0% |
| Visitor spending | $416.9 million | -9.6% | $4.30 billion | +8.1% |
| Spending per person per day | $328.90 | +13.3% | $336.40 | +14.1% |
| Average length of stay | 6.28 days | 7.44 days a year earlier | 7.02 days | 7.85 days a year earlier |
Source: Hawai’i DBEDT, news release on August 2026 visitor statistics, 30 September 2026
Most visitors still sleep in hotels. In August 2026, statewide, 55.3% of visitors from the U.S. West stayed in hotels, 13.4% in condominiums, 13.2% in timeshares and 10.4% in rental homes, DBEDT reports. The same release says 84.0% of U.S. West visitors had been to Hawai’i before.
The baseline for every Maui comparison is August 2023. In the wildfires of 8 August that year 102 people were killed, and, as Honolulu Civil Beat reported on 7 August 2026, nearly 13,000 people were displaced and more than 2,200 structures destroyed. Counted in arrivals alone, visitor numbers have come most of the way back. Maui Now reported DBEDT's director, James Kunane Tokioka, as saying that July 2026, at 247,857 visitors, was an 83.4% recovery against the 297,082 of July 2023, the month before the fires.
Arrivals measure the visitor economy and nothing else. On housing, the Honolulu Star-Advertiser reported on 2 August 2026, citing county data, that 577 residential units in Lahaina were rebuilt or new and that 702 households were still receiving temporary housing help from FEMA in late July. The Kīhei hosts, in their own guide to visiting Lahaina, link the two economies this way: “Tourism is the paycheck for a huge share of West Maui, and when it collapsed after the fire, the people who had lost the most lost their jobs on top of it.” That is their statement and not a statistic.
August and the two storms
Maui's average daily census, the number of visitors on the island on an average day, fell 20.2% in August 2026, to 40,885 from 51,265 a year earlier, DBEDT reports. Arrivals fell much less: 201,789 visitors against 213,639, down 5.5%. Spending was $416.9 million, down 9.6% from $461.3 million.
The difference between the two falls is the length of stay. The average August visit to Maui lasted 6.28 days, against 7.44 a year earlier. Spending per person per day rose 13.3% to $328.90, but spending per trip fell 4.3% to $2,065.80. For lodging the census is the closer measure, because it counts the people present on a given night. Statewide, visitors were down 5.6% to 772,039 and spending down 9.7% to $1.59 billion.

Two storms fell inside the month. Hurricane Lala went by to the south from 14 to 16 August and, in the words of DBEDT's release, “caused extensive flooding, landslides, property and infrastructure damage and power outages across the state.” Tropical Storm Moke followed from 22 to 24 August, with heavy rain and wind on parts of Hawai’i Island and East Maui. The release cites more than 120 cancelled flights at Alaska and Hawaiian Airlines and more than 80 at Southwest during Lala.
The director's statement in the release puts the damage in money: “Lala caused an estimated $3–$5 billion in total damage and economic loss in Hawai‘i.” It also says the two storms came on top of a summer that was already soft for arrivals. The release does not divide August's fall between the storms and that softness. The September visitor figures had not been published when this report was written on 11 October 2026.
The lodging reports for the month do not move as one. Wailea/Kīhei rental demand fell 2.3% and West Maui's rose 12.7%, while Wailea's hotel occupancy rose 3.8 points. A month in which the island's daily census fell by a fifth produced a small fall in South Maui rental nights. The reports come from different data sets and do not reconcile the counts.
Seats across the Pacific
Hawai’i was served by 5,038 transpacific flights with 1,106,477 seats in August 2026, DBEDT reports. That was 0.7% more flights and 0.7% fewer seats than in August 2025. Seat supply was close to flat in a month when state arrivals fell 5.6%.
The domestic total rose: 4,337 non-stop flights from the continental United States with 911,975 seats, up 1.2% in seats. Canada went the other way, with 65 flights and 11,399 seats, down 22.2%, which the release attributes to “reduced service from Calgary and Vancouver”. For the first eight months there were 9,251,632 transpacific seats, up 4.5%.
The release gives state totals and does not say how many of the seats landed at Kahului, Maui's main airport. DBEDT's separate island files were not read for this report, so no Maui seat count is given here, and the statewide 0.7% should not be read as a Maui number.
The taxes on a guest's bill
Hawai’i's transient accommodations tax (TAT) rose to 11.00% on 1 January 2026. The Department of Taxation's Announcement No. 2025-03, dated 9 June 2025, says Act 96 adds 0.75 points to the old rate of 10.25%, charged on the gross rent of transient accommodations and of resort time share units.
The 0.75 points are the Green Fee. Spectrum News Hawai’i reported on 24 December 2025 that the state expects about $100 million a year from it, meant for hazard mitigation, climate resilience and stewardship, and that a cruise-industry lawsuit had failed to stop it.
Maui County adds its own layer. Its transient accommodations tax, MCTAT for short, is 3% and has applied since 1 November 2021. The county's page says it is charged on top of the state tax and of the general excise tax.
General excise tax is the third charge. On Maui the state's 4% carries a 0.5% county surcharge until the end of 2030, and the Department of Taxation, in its Announcement No. 2023-05, gives 4.7120% as the most a business may visibly pass on.
Added together, by our arithmetic, the three come to 18.712% of the rent where all are passed on at those rates. Before 2026 the same sum was 17.962%. On $1,000 of rent the difference is $7.50. This report has not established whether taxes are inside the Total Rate in the state's rental table; the definition quoted earlier names fees only.
The county changed how its tax is filed this month. Its Announcement No. 2026-03, dated 5 October 2026, opened an online system called myMauiTAT, with the first due date on 20 October. Paying by eCheck costs nothing. Paying by card costs $2.50 for each TA number plus 2.5% of the payment, the county's page says. The county does not register operators separately: its account is built from the state tax number an operator already holds.
What it costs to hold a rental condo
A short-term rental condo on Maui is taxed at $13.00 on each $1,000 of assessed value up to $900,000 in fiscal 2026-27, the county tax year that began on 1 July. The next band, up to $3 million, pays $15.00 and anything higher pays $17.00. The county council finalised the rates in May 2026, in its Resolution 26-69. They are quoted here from a summary on the website of Maui Real Estate, a brokerage, and not from the county's own copy.
A year earlier the three rates were $12.50, $14.00 and $15.55, and the first band ran to $1,000,000. The bottom rate rose by 50 cents and the first threshold dropped by $100,000.
The class is called TVR-STRH. By the county's definition it covers units let to transient tenants for less than six consecutive months. The county's rates page also says a property is put in a class according to its highest and best use.
In the same table a short-term rental condo pays more per $1,000 than a hotel ($11.80) at every tier. The distance to residential use is wider: the Apartment class is $3.50, Long-Term Rental starts at $2.90 and Owner-Occupied at $1.65.
US dollars per $1,000 of assessed value
| Class | Band of assessed value | Rate per $1,000 of assessed value |
|---|---|---|
| Owner-Occupied | First tier | $1.65 |
| Long-Term Rental | First tier | $2.90 |
| Apartment | Rate as listed | $3.50 |
| Hotel and Resort | Rate as listed | $11.80 |
| TVR-STRH tier 1 | Up to $900,000 | $13.00 |
| Timeshare | Rate as listed | $14.90 |
| TVR-STRH tier 2 | $900,001 to $3,000,000 | $15.00 |
| TVR-STRH tier 3 | Above $3,000,000 | $17.00 |
Rates as summarised by the brokerage Maui Real Estate; the county's own copy of Resolution 26-69 was not read for this report.
Source: Maui Real Estate (brokerage), Maui County 2026/2027 Property Tax Rates, posted 19 May 2026 and updated 2 June 2026
A worked example shows the scale. UHERO, the economic research unit of the University of Hawai’i, put the median appraised value of a unit on the county's apartment-district rental list at $971,500 in June 2024; the median for all Maui condos was $845,000. If the bands work marginally, a point this report did not check with the county, a condo assessed at that $971,500 and taxed as TVR-STRH owes $12,772.50 for the year. At the rates of the year before it owed $12,143.75. The example is built on a market median. It is not the assessed value or the tax bill of any condo in this article.
The class is also a large part of the county's income. Maui Now's report of 30 September 2026 has Council Chair Alice Lee putting annual real property tax revenue near $640 million, with roughly 40% of it paid by short-term vacation rentals.
Tax is one holding cost, and the published tables stop there. Renovation is another, and it is private. The hosts of Maui Beachside Bungalows say on their site that one two-bedroom condo was renovated “from the studs out”. The cost of such work is private, and none is estimated here. Association dues, insurance and cleaning are likewise outside every source used.
What the booking platform takes
Most hosts on Airbnb's single service fee pay 15.5% of a booking, according to the company's help centre page on service fees. Under the older split fee, the same page says, most hosts pay 3% and guests pay between 14.1% and 16.5% of the booking subtotal. Airbnb says it is moving all home hosts to the single structure and that the move is one-way for a host.
On a host's own ledger the change is 12.5 points: on $1,000 of booking value the host-side fee goes from $30 to $155. Under the split fee the guest was paying a fee on top, so the two structures cannot be compared on the host's line alone. Airbnb's page does not say how hosts have repriced, and no data set used here does either.

The fee weighs most on a host whose bookings all run through the platform, and the four North Kīhei condos are an example of that set-up. On the Maui Beachside Bungalows site, each condo's button opens its Airbnb listing, and the site takes no reservations or payments itself.
Which of Airbnb's two fee structures the business is on is not public, and this report does not guess. What can be counted from the hosts' pages is the record that sits on the platform: the four listings carry, added up, 447 reviews as of October 2026. That is a count the hosts publish from Airbnb, and it was not checked against Airbnb for this report.
The state's data shares the reliance on platforms. DBEDT's rental report is built from listings on Airbnb, Booking.com, Vrbo and TripAdvisor.
The supply covered by Bill 9
The County of Maui keeps a list of apartment-district properties where short-term occupancy is allowed. The version dated 27 June 2024 has 104 properties and a printed total of 7,167 vacation rental units. That total is the supply in the path of Bill 9, the county law that phases out transient vacation renting in the A-1 and A-2 Apartment Districts.
The law is Ordinance 5909. Maui Now reported that the council gave it final approval by five votes to three on 15 December 2025, and that Mayor Richard Bissen signed it that day and said it would restore housing for residents. The phase-out dates Maui Now gives are 1 January 2029 for West Maui and, for everywhere else in the county including South Maui, 1 January 2031. The law does not reach vacation rentals in zones that allow them, or hotels, timeshares and bed-and-breakfasts.
How many units that means depends on who is counting.
- 7,167 is the total printed on the county's June 2024 list.
- 6,208 of those were in use as short-term rentals when the county's Department of Finance counted on 29 May 2024, Maui Now reported.
- 6,172 is UHERO's June 2024 count of listed units in operation. It put all transient vacation rentals on Maui at about 13,000.
- News reports round these to about 7,000 or roughly 6,100, depending on the count they start from.
South Maui has about 60% of the affected units, West Maui about 36% and Hāna, Pā’ia and Moloka’i about 4%, Maui Now reported. The largest share of the supply the law covers is on the south shore, and so is the later deadline.

The state's supply table cannot show any of this. DBEDT's 137,414 unit nights for Wailea/Kīhei are not split by zoning. Nor does this report place any individual property on either side of the line, the four condos used here for scale included. The county's list carries its own caution: it says it may contain errors, and that anyone who needs to know whether a property may be let short-term should get confirmation from the Department of Planning.
UHERO's 2024 study describes the listed units: a median size of 838 square feet, a median build year of 1977, and a mailing address outside Hawai’i for 85% of the 6,172.
The 397 units recommended for exemption
Rezoning is the exit. A listed complex moved into one of two hotel districts created in June 2026, H-3 or H-4, would fall outside the phase-out. Maui Now reported that the ordinance creating the districts moved no property by itself. Two batches of rezoning proposals have since gone to the Maui Planning Commission. The council sent the first on 24 July, and its size depends on the newspaper: about 2,056 units in Maui Now, 3,402 units in 48 properties in the Star-Advertiser.
On 22 September, the Star-Advertiser reported, commissioners voted 6-2 to advise against all but five of those properties. The five hold 397 units, and Hale Kaanapali, with 262, is the largest. The properties turned down include two in Kīhei, Kamaole Sands (440 units) and Luana Kai (113), and four phases in Wailea with 404 units. Six of the nine council members can still overrule the commission.
The second batch is Resolution 26-129, referred on 29 September by a 5-4 vote. Maui Now's report counts 32 complexes in it, spread across Mā’alaea, Kīhei and West Maui, and gives the test for inclusion: more than half of a building's footprint inside a sea-level-rise exposure area, a special flood hazard area or the shoreline setback. A referral rezones nothing, and no unit total for the 32 was available for this report.

What the university expects it to cost
The main projections are UHERO's. Its economic analysis of the phase-out, paid for by the Hawai’i Community Foundation and released on 31 March 2025, is summarised by University of Hawai’i News. On the housing side it projects as many as 6,127 more long-term units, which would enlarge that stock by 13%, and condo prices 20% to 40% lower. On the visitor side it projects 25% fewer visitor accommodations, 32% fewer visitor days, $900 million a year less visitor spending, a 15% fall, 1,900 fewer jobs and real GDP down 4%. For the county's budget it projects as much as $60 million a year less property tax by 2029.
The county's own numbers are argued over. The mayor's office has used the same $60 million for lost revenue and described it as manageable, according to Maui Now's December 2025 report. Council Vice Chair Yuki Lei Sugimura's figure, in Maui Now on 30 September 2026, is $94 million a year.
Two lawsuits, Malter v. Maui County and Lynam v. County of Maui, were filed in December 2025, Maui Now reported on 2 January 2026. The second seeks class-action status on behalf of all owners on the list. The coverage read for this report, up to 30 September 2026, shows no ruling in either.
What the figures do and do not tell you
The most useful single caution is DBEDT's own figure for its coverage: reservation-system data for “31.5 percent of Maui County”. The rental rates and occupancy in this report rest on listing counts and on reservation data for about a third of the county.
Within that limit the figures say several things plainly. South Maui's vacation rentals sold 52.3% of their unit nights in the first eight months of 2026 and 42.8% in August, while Wailea's hotels filled 73.6% of their rooms that month. West Maui's rental rate is nearly twice South Maui's and its supply is growing. The state tax on a stay is 0.75 points higher than in 2025, and the usual host fee on Airbnb's single structure is 15.5%. The county's list holds 7,167 units, South Maui has about 60% of those affected, and 397 have a planning commission recommendation for hotel zoning.

What the figures do not tell you
None of these numbers describes a single host. The state's rate is an area average of total prices, fees included, and cannot be read as the price of any condo, including the four used here for scale. The supply counts do not separate permitted from unpermitted units or one zone from another. Lighthouse restated its history in July 2026, so earlier monthly reports do not line up with August. The seat figures are statewide. UHERO's projections date from March 2025 and model the proposal as it then stood. September's visitor data was not out on 11 October 2026.
What remains open is mostly dated. The first county tax filing under the new online system is due on 20 October 2026. In the coverage read for this report, Resolution 26-129 is before the Maui Planning Commission and the two lawsuits are undecided. The deadline for South Maui is 1 January 2031, which leaves four full calendar years of DBEDT monthly reports before it.
Maui Beachside Bungalows publishes its own pages, with the four condos, its local guides and its Airbnb links, at mauibeachvacationrentals.com. Nothing on them is a market statistic, and nothing in this report is a statement about that business's bookings, prices or income. Its place here is arithmetic: four condos, at most 124 unit nights in a 31-day month, in an area that offered 137,414.
Common questions
What was vacation rental occupancy in South Maui in August 2026?
DBEDT's August 2026 Vacation Rental Performance Report puts Wailea/Kīhei at 42.8% occupancy on 137,414 available unit nights, with an average daily rate of $438.48, fees included. For January to August 2026 the figures are 52.3% and $482.89.
How do South Maui vacation rentals compare with West Maui?
In August 2026 West Maui rentals averaged $858.33 at 46.4% occupancy, against $438.48 at 42.8% in Wailea/Kīhei, DBEDT reports. West Maui supply was up 13.3% on a year earlier and Wailea/Kīhei supply was down 1.0%.
How much tax is added to a short stay on Maui in 2026?
The state transient accommodations tax is 11.00% from 1 January 2026, the Maui County tax is 3% and the general excise tax may be passed on at up to 4.712%. Added together, by our arithmetic, that is 18.712% of the rent where all three are passed on.
How many Maui vacation rentals does Bill 9 cover?
The County of Maui's June 2024 list gives 7,167 apartment-district vacation rental units. The county's Department of Finance counted 6,208 of them operating in May 2024, and UHERO counted 6,172. Maui Now reported that about 60% of the affected units are in South Maui.
Do these figures show what any one rental charges or earns?
No. The state's rates are area averages of total prices, with fees included, built on listing counts and reservation data for 31.5 percent of Maui County. No figure in this report describes a single host or a single condo.
Sources
- Hawai’i Department of Business, Economic Development and Tourism, August 2026 Hawai’i Vacation Rental Performance Report (September 2026).
- Hawai’i Department of Business, Economic Development and Tourism, August 2026 Hawai’i Hotel Performance Report (September 2026).
- Hawai’i Department of Business, Economic Development and Tourism, August 2026 Visitor Spending and Arrivals Declined (news release) (30 September 2026).
- Hawai’i Department of Taxation, Announcement No. 2025-03, Act 96 and the transient accommodations tax (9 June 2025).
- Hawai’i Department of Taxation, Announcement No. 2023-05, Maui County Surcharge on General Excise Tax and Rate of Tax Visibly Passed on to Customers (25 September 2023).
- County of Maui, Maui County Transient Accommodations Tax (MCTAT) page and Announcement No. 2026-03 (5 October 2026).
- County of Maui, Real Property Tax Rates, class definitions (read 11 October 2026).
- County of Maui, Apartment District Properties Allowed to be Used for Short-Term Occupancy (27 June 2024).
- Maui Real Estate (Pete Jalbert, broker), Maui County 2026/2027 Property Tax Rates (19 May 2026, updated 2 June 2026).
- University of Hawai’i News, Maui transient vacation rental phaseout: more housing, fewer jobs (31 March 2025).
- UHERO, University of Hawai’i Economic Research Organization, Maui Short-Term Rentals, the Minatoya List, and Housing Supply (25 June 2024).
- Maui Now, Mayor Bissen signs Bill 9 into law; says it will restore housing availability for residents (15 December 2025).
- Maui Now, As expected, Bill 9 challenged in court; lawsuits seek to block short-term rental phaseout (2 January 2026).
- Maui Now, Maui Council advances new hotel zoning for over 2,000 apartment-district vacation rentals (28 July 2026).
- Maui Now, Visitor spending and arrivals increased to Maui in July 2026 (27 August 2026).
- Maui Now, Maui Council refers 32 shoreline condo complexes’ hotel-rezoning to Maui Planning Commission (30 September 2026).
- Honolulu Star-Advertiser, Maui Planning Commission rebuffs exemptions to vacation rental ban (23 September 2026).
- Honolulu Star-Advertiser, Three years later, many Lahaina fire survivors are still waiting for a home (2 August 2026).
- Honolulu Civil Beat, Maui Wildfires 3 Years Later: The Recovery In Photos (7 August 2026).
- Spectrum News Hawai’i, Green Fee to take effect on Jan. 1 (24 December 2025).
- Airbnb Help Centre, Airbnb service fees (read 11 October 2026).
A note on this story: Booked News's publisher works with Maui Beachside Bungalows on its marketing. The facts here come from the hosts' published pages and the public sources listed above. Sources were read on or before 11 October 2026. To report an error, write to the desk; see the corrections policy.

More features
 Photograph by Wilfredor, CC0, via Wikimedia Commons.Market report · ReturnsForeign Buyers in Rio's South Zone by the NumbersBy Callum Reid · 20 min read
 Photograph by CaptJayRuffins, CC BY-SA 4.0, via Wikimedia Commons.Market report · ReturnsSt. Croix Against St. Thomas and St. John in Villa and Home-Price NumbersBy Ruth Okafor · 20 min read
 Photograph by Jason P. Heym, Seascape Pool Center, Inc. (Jpheym), CC BY-SA 3.0, via Wikimedia Commons.Market report · SupplySt. Croix's Winter in Numbers for Villas and HotelsBy Sunita Rao · 20 min read
Comments