St. Croix Against St. Thomas and St. John in Villa and Home-Price Numbers
St. Croix took about a fifth of the U.S. Virgin Islands' air arrivals in 2025 and has outgrown the St. Thomas district since May 2026. Government tables, vendor estimates and one 13-home manager show how far apart the islands are.
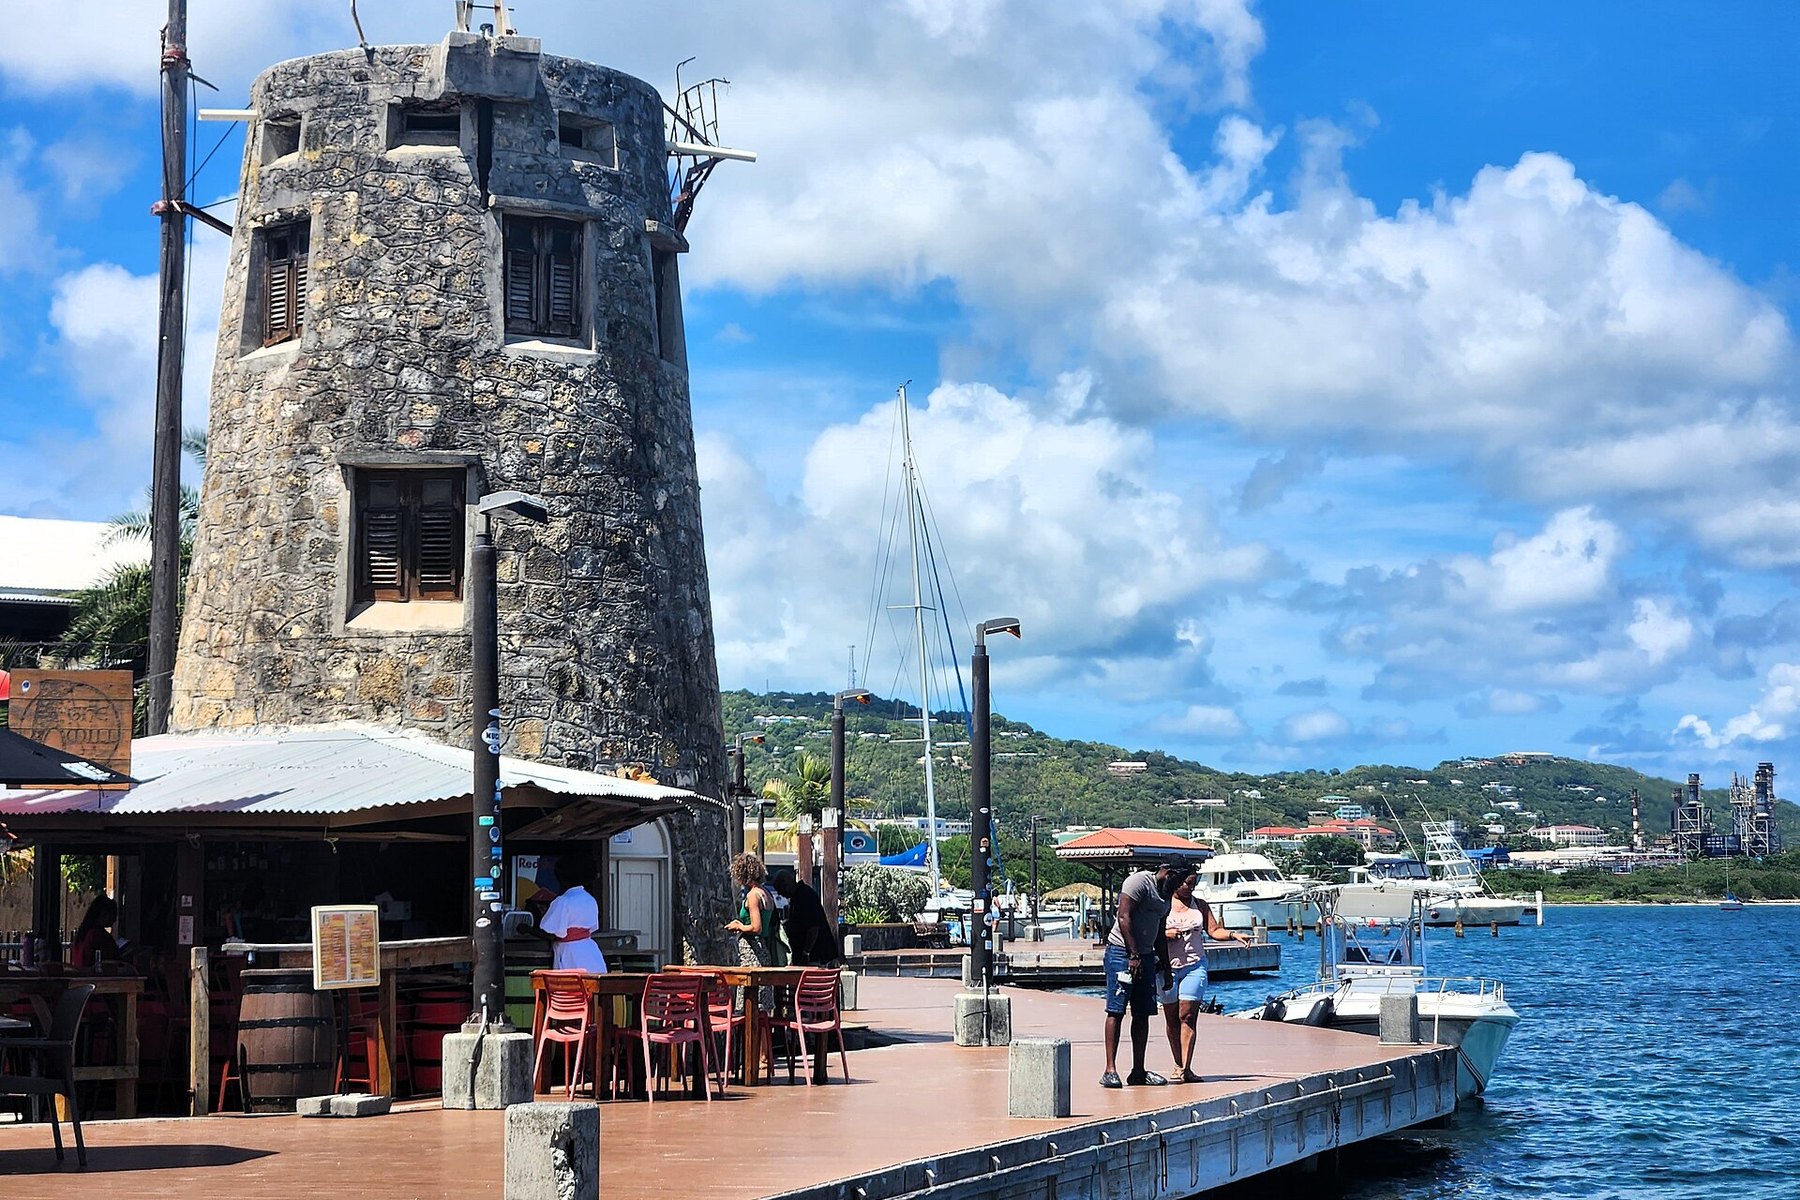
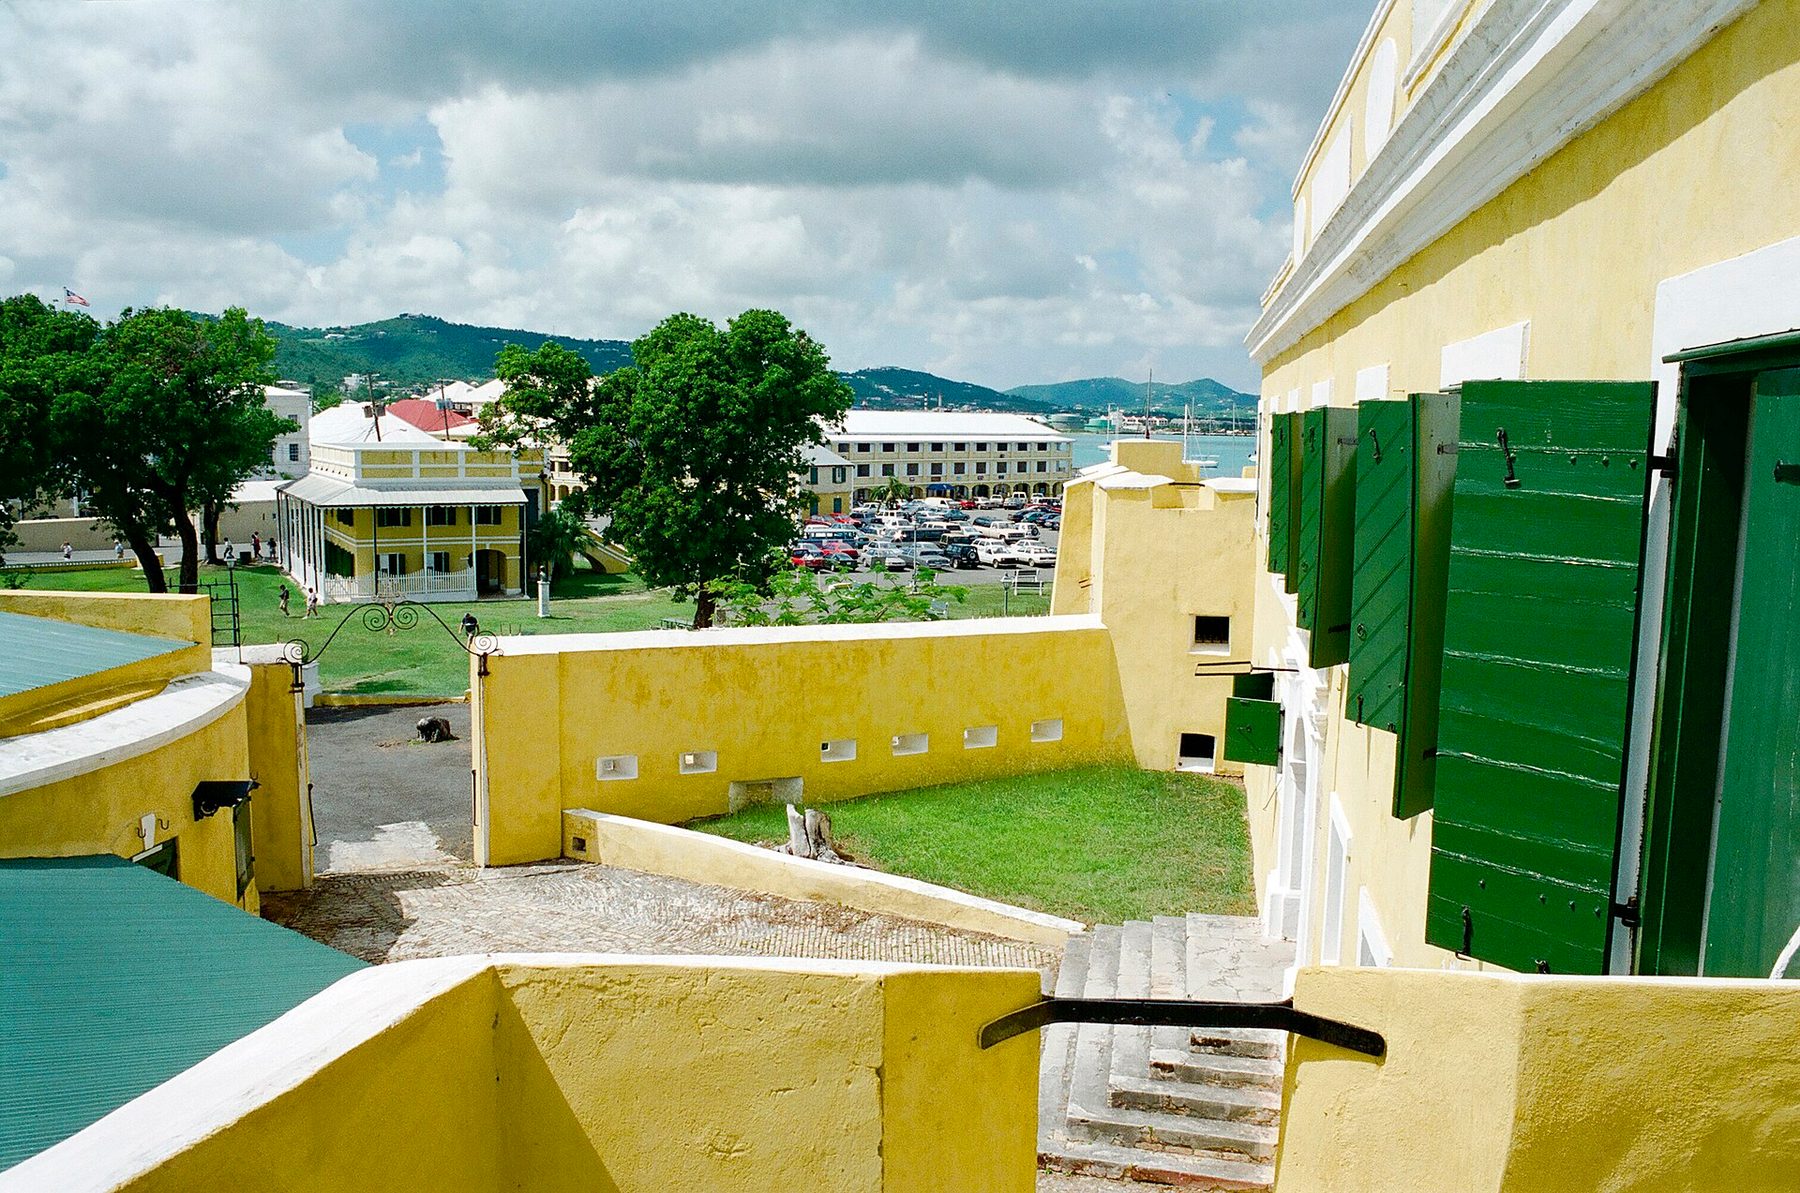
TheMill20230924 111011 by CaptJayRuffins, CC BY-SA 4.0, via Wikimedia Commons (cropped and resized)
Spirit Airlines stopped flying on 2 May 2026. In the three summer months that followed, the two districts of the U.S. Virgin Islands moved in opposite directions. Air arrivals on St. Croix rose 14.8% in June, 8.8% in July and 26.2% in August against the same months of 2025. In the St. Thomas and St. John district they fell 4.2%, 2.1% and 3.5%. The figures are from the air visitor arrivals table that the territory's Bureau of Economic Research (BER) dated 24 September 2026.
On most other lines St. Croix is the smaller and cheaper market. In 2025 it received 185,349 of the territory's 908,913 air arrivals, about a fifth. Its hotels and other reporting accommodations sold 51.6% of their room nights, against 61.3% in St. Thomas and St. John. A single-family house sold for a median of $725,000 in the second quarter of 2026, against $1,050,000 on St. Thomas, by one brokerage's count. Listing data, all of it estimated, puts a rental night in Christiansted below one on St. Thomas and at less than half of one in Cruz Bay on St. John.
This report sets the islands side by side, table by table, and says where the tables disagree. It uses one company for scale. SP Vacations is the vacation-rental side of Sterling Point Real Estate, a brokerage in Christiansted, and on 11 October 2026 its site listed 13 rental homes, all on St. Croix. No revenue, rate or occupancy figure for those homes is public, and none is given or implied here.
One limit applies throughout. The government reports St. Thomas and St. John as a single district in nearly every table, so most of the comparison is between two districts. St. John stands alone only in licence counts and in vendor estimates.
Air arrivals by island in 2025 and 2026
St. Croix received 145,499 air arrivals in the first eight months of 2026, up 6.7% on the same months of 2025, the BER table shows. St. Thomas and St. John received 587,606, up 9.8%. For the whole of 2025 the same table gives 723,563 for St. Thomas and St. John and 185,349 for St. Croix. By our arithmetic St. Croix's share of the 2025 total was 20.4%.
St. Croix's year began badly and then turned. January brought 16,690 arrivals, down 25.7% from 22,464 a year earlier, and the first quarter ended 5.3% down at 56,370. St. Thomas and St. John were up 17.4% in the same quarter, at 250,232. In the second quarter the order reversed: St. Croix rose 15.6% to 51,453 and the larger district 9.0% to 223,244.
Percent change, 2026 on 2025
St. Thomas/St. John change (%)St. Croix change (%)
| Period | St. Thomas/St. John 2025 | St. Thomas/St. John 2026 | St. Thomas/St. John change (%) | St. Croix 2025 | St. Croix 2026 | St. Croix change (%) |
|---|---|---|---|---|---|---|
| January | 69,335 | 74,844 | 7.9 | 22,464 | 16,690 | -25.7 |
| February | 64,656 | 77,129 | 19.3 | 17,586 | 18,136 | 3.1 |
| March | 79,095 | 98,259 | 24.2 | 19,480 | 21,543 | 10.6 |
| April | 69,686 | 81,705 | 17.2 | 11,668 | 13,034 | 11.7 |
| May | 63,628 | 72,959 | 14.7 | 16,479 | 19,622 | 19.1 |
| June | 71,582 | 68,580 | -4.2 | 16,374 | 18,797 | 14.8 |
| July | 71,808 | 70,279 | -2.1 | 18,270 | 19,877 | 8.8 |
| August | 45,434 | 43,851 | -3.5 | 14,100 | 17,799 | 26.2 |
| January to August | 535,225 | 587,606 | 9.8 | 136,423 | 145,499 | 6.7 |
Island columns only. The table's printed territory total for 2026 does not equal the sum of the two columns in April and is not shown. Subject to revision.
Source: U.S. Virgin Islands Bureau of Economic Research, Air Visitor Arrivals, January 2025 to August 2026, dated 24 September 2026
The table needs one correction before anyone adds it up. It prints a territory total of 744,449 for January to August, up 10.8%. But its April line gives the territory 106,083 arrivals where the two island columns for that month, 81,705 and 13,034, add to 94,739. Adding the island columns for all eight months gives 733,105. This report uses the island columns, which sum correctly, and leaves the printed total aside.
For a longer view, the bureau's 2024 tourism and accommodations report counts 907,366 air arrivals in the territory in 2024, up 16.2% on 2023, and names more frequent direct flights among the reasons visitor numbers rose. The 2025 total of 908,913 was 1,547 higher, so growth had all but stopped. In the first eight months of 2026 both districts grew again, and from June only St. Croix did.
What changed after May 2026
From June to August 2026 St. Croix received 56,473 air arrivals, 7,729 more than in the same three months of 2025. St. Thomas and St. John received 182,710, which was 6,114 fewer. Both sums are our addition of the bureau's monthly figures.
The BER table gives no cause. The timing follows the end of Spirit Airlines, which ceased operations on 2 May 2026, as OPB reported that day. The day before, VI Consortium had reported that Spirit, marking 20 years of flying to St. Thomas the previous December, had described itself as “the only airline offering nonstop service from St. Thomas to both Fort Lauderdale and Orlando”, and that its Fort Lauderdale flights also served St. Croix. Both islands lost an airline. No seat count by island was read for this report, so the link between the shutdown and the monthly figures is a sequence of dates and nothing firmer.
One new route runs the other way. United begins a Saturday nonstop from Newark to St. Croix on 31 October 2026, on a Boeing 737-700 with 126 seats, according to the release it issued with the Department of Tourism on 1 June 2026. One weekly flight of that size is small against months that bring 13,000 to 21,500 arrivals. It does serve the region that sends the other district its largest share of hotel guests: in the bureau's 2025 guest tables, dated 9 March 2026, the New York sales region supplied 29.2% of the mainland-region guests in St. Thomas and St. John and 20.1% of St. Croix's, where the Miami region led with 29.4%.

Cruise passengers had already moved the same way. The bureau's cruise table for 2025 counts 241,612 passengers on St. Croix, up 42.8% from 169,228 in 2024, and 1,553,170 in St. Thomas and St. John, up 1.5%. Cruise passengers sleep on the ship, so the figure says more about shops, taxis and tours than about beds. St. Croix's total was still under a sixth of the other district's.
Hotel occupancy and room supply by island
St. Croix's reporting accommodations sold 51.6% of their room nights in 2025, and those of St. Thomas and St. John sold 61.3%. The source is Table 1 of the BER's monthly hotel occupancy report for December 2025, dated 9 March 2026, which covers the hotels, small hotels and condominiums that report to the bureau. The territory figure was 58.7%.
The gap in supply is wider than the gap in occupancy. St. Croix had 369,949 room nights available in the year and the other district 1,025,854. Divided by 365, that is about 1,014 rooms a night against about 2,811, and St. Croix holds 26.5% of the territory's reported room nights. Its supply fell 5.7% in 2025, from 392,278 room nights, while supply in St. Thomas and St. John rose 3.1%. St. Croix's occupancy rate went up from the 49.7% that the table prints for 2024, but on fewer rooms: occupied room nights fell from 195,128 to 191,009.
Percent of reported room nights occupied
Occupancy rate 2025 (%)Occupancy, first quarter 2026 (%)
| District | Occupancy rate 2025 (%) | Room nights occupied 2025 | Room nights available 2025 | Average guest stay 2025 (nights) | Occupancy, first quarter 2025 (%) | Occupancy, first quarter 2026 (%) |
|---|---|---|---|---|---|---|
| St. Thomas/St. John | 61.3 | 628,811 | 1,025,854 | 3.6 | 72.0 | 76.0 |
| St. Croix | 51.6 | 191,009 | 369,949 | 3.7 | 57.0 | 61.6 |
| U.S. Virgin Islands | 58.7 | 819,820 | 1,395,803 | 3.6 | 67.9 | 72.2 |
The occupancy rates file prints 50.3% for St. Croix in 2025 where Table 1 prints 51.6%. All figures are subject to revision.
Source: U.S. Virgin Islands Bureau of Economic Research: Monthly Hotel Occupancy Report 2025, Table 1, dated 9 March 2026 (2025 columns); Hotel Occupancy Rates, January 2025 to June 2026 (first-quarter columns)
By type, the two districts differ most in condominiums. On St. Croix large hotels ran at 49.3% in 2025, small hotels at 53.7% and the category of condominiums and other accommodation at 55.5%. In St. Thomas and St. John large hotels ran at 69.4%, small hotels at 57.8% and condominiums at 23.5%. The average guest stayed 3.7 nights on St. Croix and 3.6 in the other district.
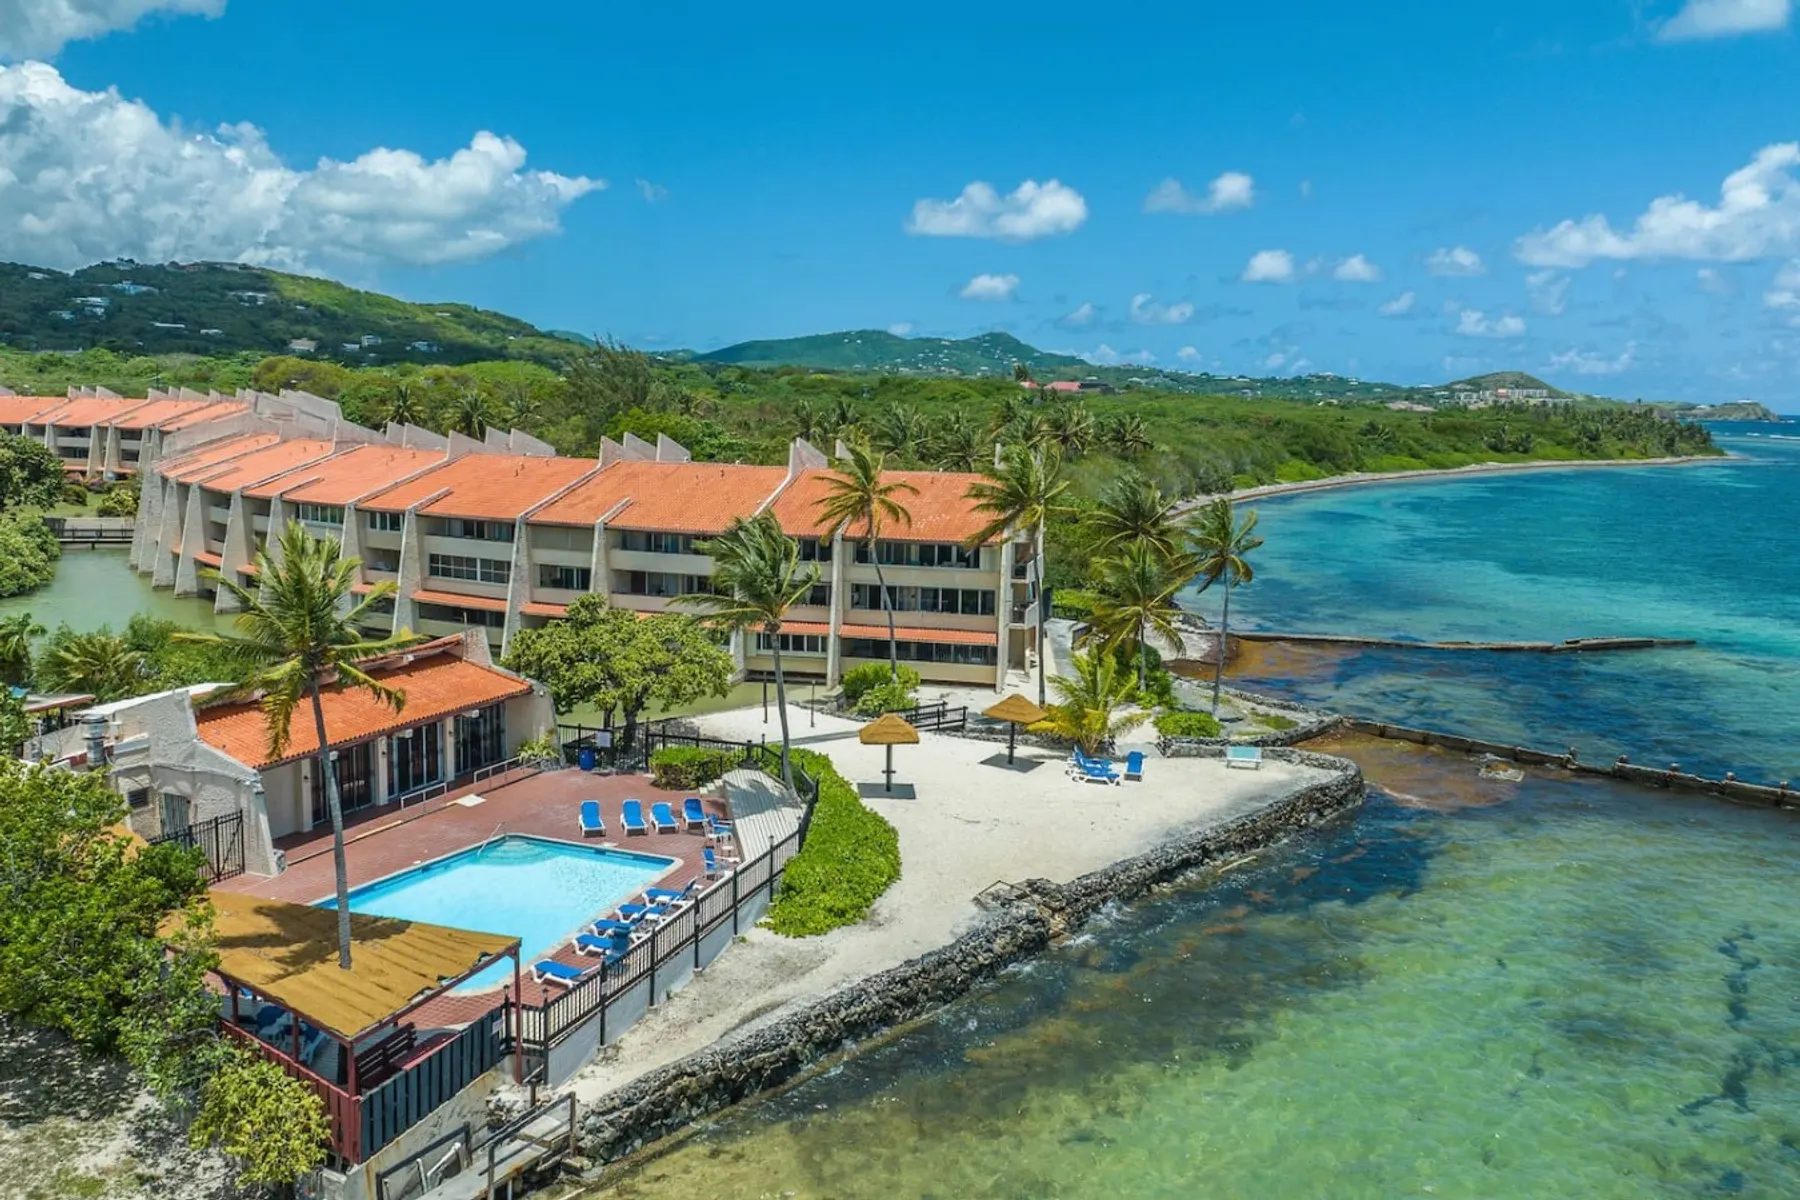
The bureau has said where it thinks condominium nights went. Its 2024 report puts territory condominium occupancy at 37.2%, down from 56.3% in 2023, and attributes the fall to “ongoing competition from Airbnb and other short-term rental services”.
For 2026 the usable figure is the first quarter. The bureau's hotel occupancy rates file for January 2025 to June 2026 gives St. Croix 61.6%, up from 57.0% a year earlier, and St. Thomas and St. John 76.0%, up from 72.0%. In the high season the districts were 14.4 points apart.
The bureau's files also disagree with each other. The rates file prints St. Croix's 2025 annual figure as 50.3% where Table 1 prints 51.6%. For 2024 the annual report says 52.0% and Table 1's prior-year column says 49.7%. The June 2026 column of the rates file repeats March's figures for St. Croix and the territory exactly, and Table 1 prints a December 2025 occupancy of 138.6% for St. Croix condominiums. Neither of those two is used here. The rates file carries the note “All Data is subject to revision”, and every BER figure in this report should be read as subject to revision.
Rental listings, rates and occupancy as vendors estimate them
The only government count of short-term rentals by island found for this report is of licences: 464 in the whole territory in 2023. The BER's 2024 report, using data from the Department of Licensing and Consumer Affairs, lists 185 new licences that year (61 on St. Thomas, 65 on St. John, 58 on St. Croix and one on Water Island) and 279 renewals (114, 149 and 16). Added together, that is 214 on St. John, 175 on St. Thomas and 74 on St. Croix.
Listing counts are several times larger. Airbnb said it had about 2,000 active listings in the territory when it began collecting the hotel room tax there in 2017. Governor Albert Bryan Jr. put the figure at 4,000 Airbnb rooms in March 2025, VI Consortium reported. The bureau's report does not reconcile licences with listings, and no source read for this report does. The two counts measure different things, and the licence figure is from 2023.
Past that point everything is a vendor's estimate from scraped listings, and for St. Croix the vendors are far apart.
- AirROI, on pages updated 12 September 2026, lists four St. Croix areas with 598 active listings between them. It puts Christiansted, the largest, at 36.6% occupancy and an average daily rate of $323. The four areas are not the whole island.
- Airbtics, in indicators it dates to January 2026, gives St. Croix 861 active listings, 58% occupancy and a nightly rate of $212.
- BNBCalc, on a page marked as of October 2026, gives an average of 1,032 active Airbnb and Vrbo listings over the 12 months to September 2026, 29% occupancy and an average daily rate of $338. A second panel on the same page shows 37% and $312.
So one island has an occupancy of 29%, 36.6% or 58% and a rate of $212, $323 or $338, depending on the vendor, its period and what it counts as an active listing. This report could not reconcile them and prints no single number of rentals for any island.
A comparison across islands is safer inside one vendor's method than across vendors. On AirROI's figures, every area it lists on St. Thomas and St. John has a higher occupancy than every area it lists on St. Croix, and a higher rate than Christiansted. The East End of St. Thomas, its largest area there with 263 listings, is at $444 and 43.8%. Cruz Bay on St. John, with 72 listings, is at $746 and 45.6%.
US dollars per booked night, vendor estimate
| Area | Active listings | Average daily rate | Occupancy |
|---|---|---|---|
| Christiansted, St. Croix | 438 | $323 | 36.6% |
| Frederiksted, St. Croix | 83 | $247 | 33.4% |
| Sion Farm, St. Croix | 47 | $241 | 40.8% |
| Frederiksted Southeast, St. Croix | 30 | $286 | 36.9% |
| East End, St. Thomas | 263 | $444 | 43.8% |
| Northside, St. Thomas | 92 | $604 | 44.1% |
| Southside, St. Thomas | 46 | $553 | 42.2% |
| Charlotte Amalie, St. Thomas | 32 | $355 | 48.3% |
| Cruz Bay, St. John | 72 | $746 | 45.6% |
Estimates from scraped listings. The areas do not cover whole islands and must not be added into an island total. Airbtics and BNBCalc give different figures for St. Croix.
Source: AirROI market pages for St. Croix, St. Thomas and St. John, updated 12 September 2026
AirROI's Christiansted page, covering August 2025 to July 2026, shows the island's largest rental area in more detail. Supply grew 17.1% in a year to 438 listings while average annual revenue per listing fell 2.1% to $26,135. Revenue per available night was $115. Entire homes were 96.1% of listings, the average stay was about seven nights and the average booking was made 74 days ahead. The estimates move with the period: a post on Sterling Point's own blog dated 23 April 2026 quoted the same vendor at $18,514 of annual revenue, $235 a night and 33.1% occupancy.
Every one of those nights carries the same tax on all three islands. The Bureau of Internal Revenue's Form 722 V.I. sets the hotel room tax at 12.5% of the gross room rate on a villa, condominium or residence let for “less than 90 days”. Airbnb has collected it for its hosts since a 2017 agreement, and on other channels and direct bookings the owner or manager files monthly. Governor Bryan proposed a 20% rate on Airbnb-type rentals in March 2025 and, as VI Consortium reported it, said villas serve a different clientele and should not pay the higher rate. This report describes that only as proposed. The BER's 2024 report puts non-hotel room tax collections at $17.6 million in 2024 and hotel room tax revenues at $33.4 million, up from $25.4 million in 2023.
The season on each island and one manager's calendar
September 2025 brought 5,868 air arrivals to St. Croix, against 22,464 in January of the same year, the BER table shows. St. Thomas and St. John fell from a March peak of 79,095 to 24,690 in September. On both sides of the territory the low month delivered between a quarter and a third of the peak month.
Hotels follow the same curve. The bureau's 2024 report names February as the territory's fullest month that year, at 77.9% occupancy, and September as the emptiest, at 38.3%. AirROI's estimate for Christiansted rentals has the same shape: March is its best month for revenue and September its worst.
The trough sits on the hurricane calendar. The Atlantic season runs from 1 June to 30 November, and the National Hurricane Center puts its peak at 10 September. No premium or deductible figure for the territory in 2025 or 2026 could be sourced for this report, so the cost of insuring a rental house through that season is left out.
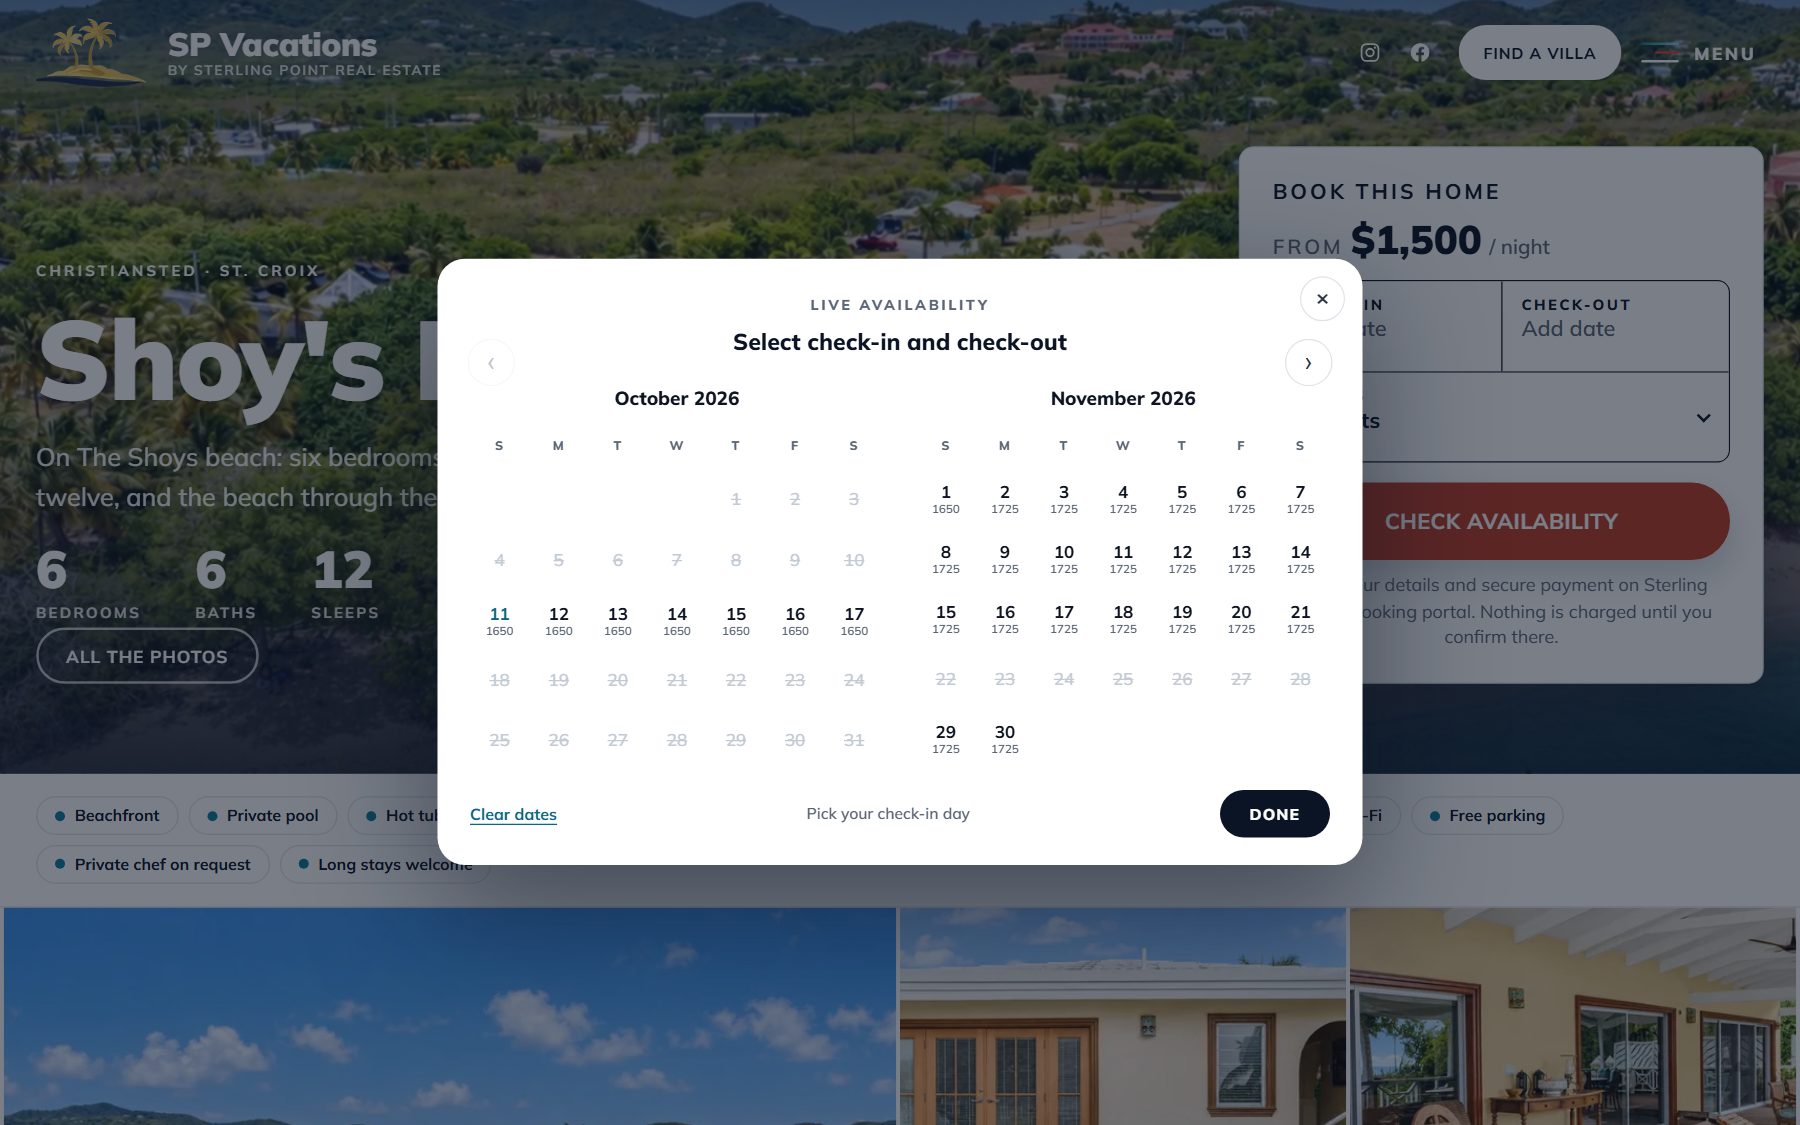
A manager's calendar shows the season from the other end, months before the arrivals are counted. On 11 October 2026 the public search on SP Vacations' site was asked for seven nights for two guests in six sample weeks. The number of its 13 homes shown as available was:
- 7 to 14 November 2026: 9
- 26 December 2026 to 2 January 2027: 5
- 6 to 13 February 2027: 4
- 13 to 20 March 2027: 9
- 12 to 19 June 2027: 10
- 11 to 18 September 2027: 13
This is a one-day snapshot and it is not occupancy. A home that does not appear may be booked, held back by its owner, or excluded by a minimum-stay or arrival-day rule. What the count does show is the order of the weeks. Four months ahead, the February week had the fewest homes open and the September week had all of them.
Home prices and sales by island
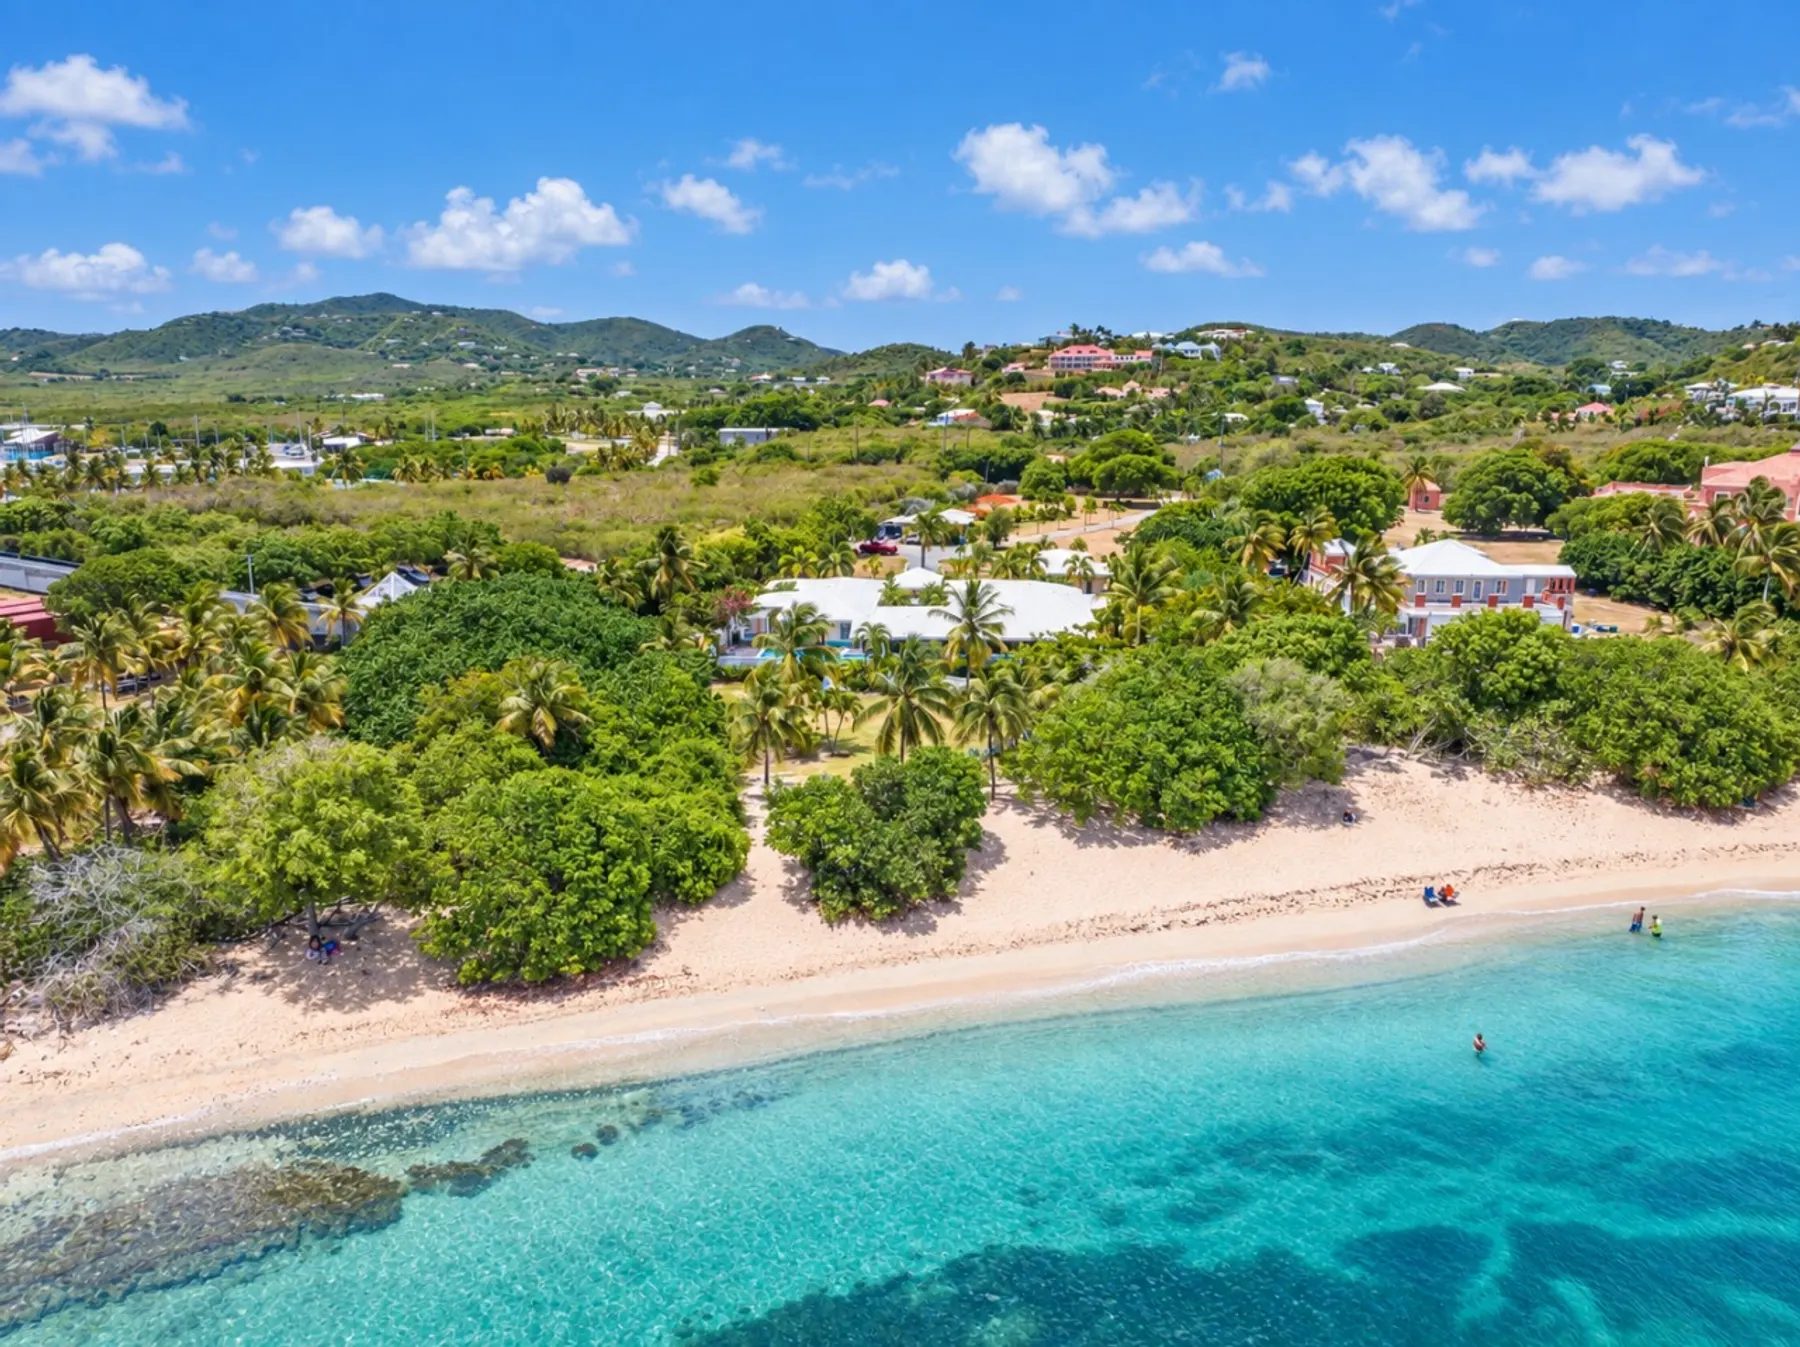
The median sold price on St. Croix in the second quarter of 2026 was $320,000 across all property types, up 42% on a year earlier, and on St. Thomas it was $450,000, up 23%. Both figures are from quarterly reports that Coldwell Banker St. Croix Realty published on 13 July 2026. The reports cite “Coldwell Banker's Q2 2026 data” and name no multiple listing service, so they are one brokerage's compilation.
St. Croix had more sales and St. Thomas the higher prices. St. Croix recorded 125 sales in the quarter, against 127 a year earlier, and St. Thomas 85, against 71. For single-family homes the medians were $725,000 on St. Croix, on 57 sales, and $1,050,000 on St. Thomas, on 33: a difference of $325,000, or about 31%. Condominiums sold at a median of $265,000 on St. Croix and $420,000 on St. Thomas. Land is mostly a St. Croix trade, with 41 sales against 9.
US dollars
St. Croix median sold priceSt. Thomas median sold price
| Property type | St. Croix sales | St. Croix median sold price | St. Thomas sales | St. Thomas median sold price |
|---|---|---|---|---|
| All types | 125 | $320,000 | 85 | $450,000 |
| Single-family homes | 57 | $725,000 | 33 | $1,050,000 |
| Condominiums | 27 | $265,000 | 43 | $420,000 |
Median days on market, all types: St. Croix 192, St. Thomas 127. Land sales: St. Croix 41, St. Thomas 9. One brokerage's compilation; no St. John report was found.
Source: Coldwell Banker St. Croix Realty, St. Croix and St. Thomas Q2 2026 quarterly reports, 13 July 2026
Time is the other price. The median St. Croix sale took 192 days on the market, up from 168, and the median St. Thomas sale took 127, down from 148. The St. Croix seller waited 65 days longer.
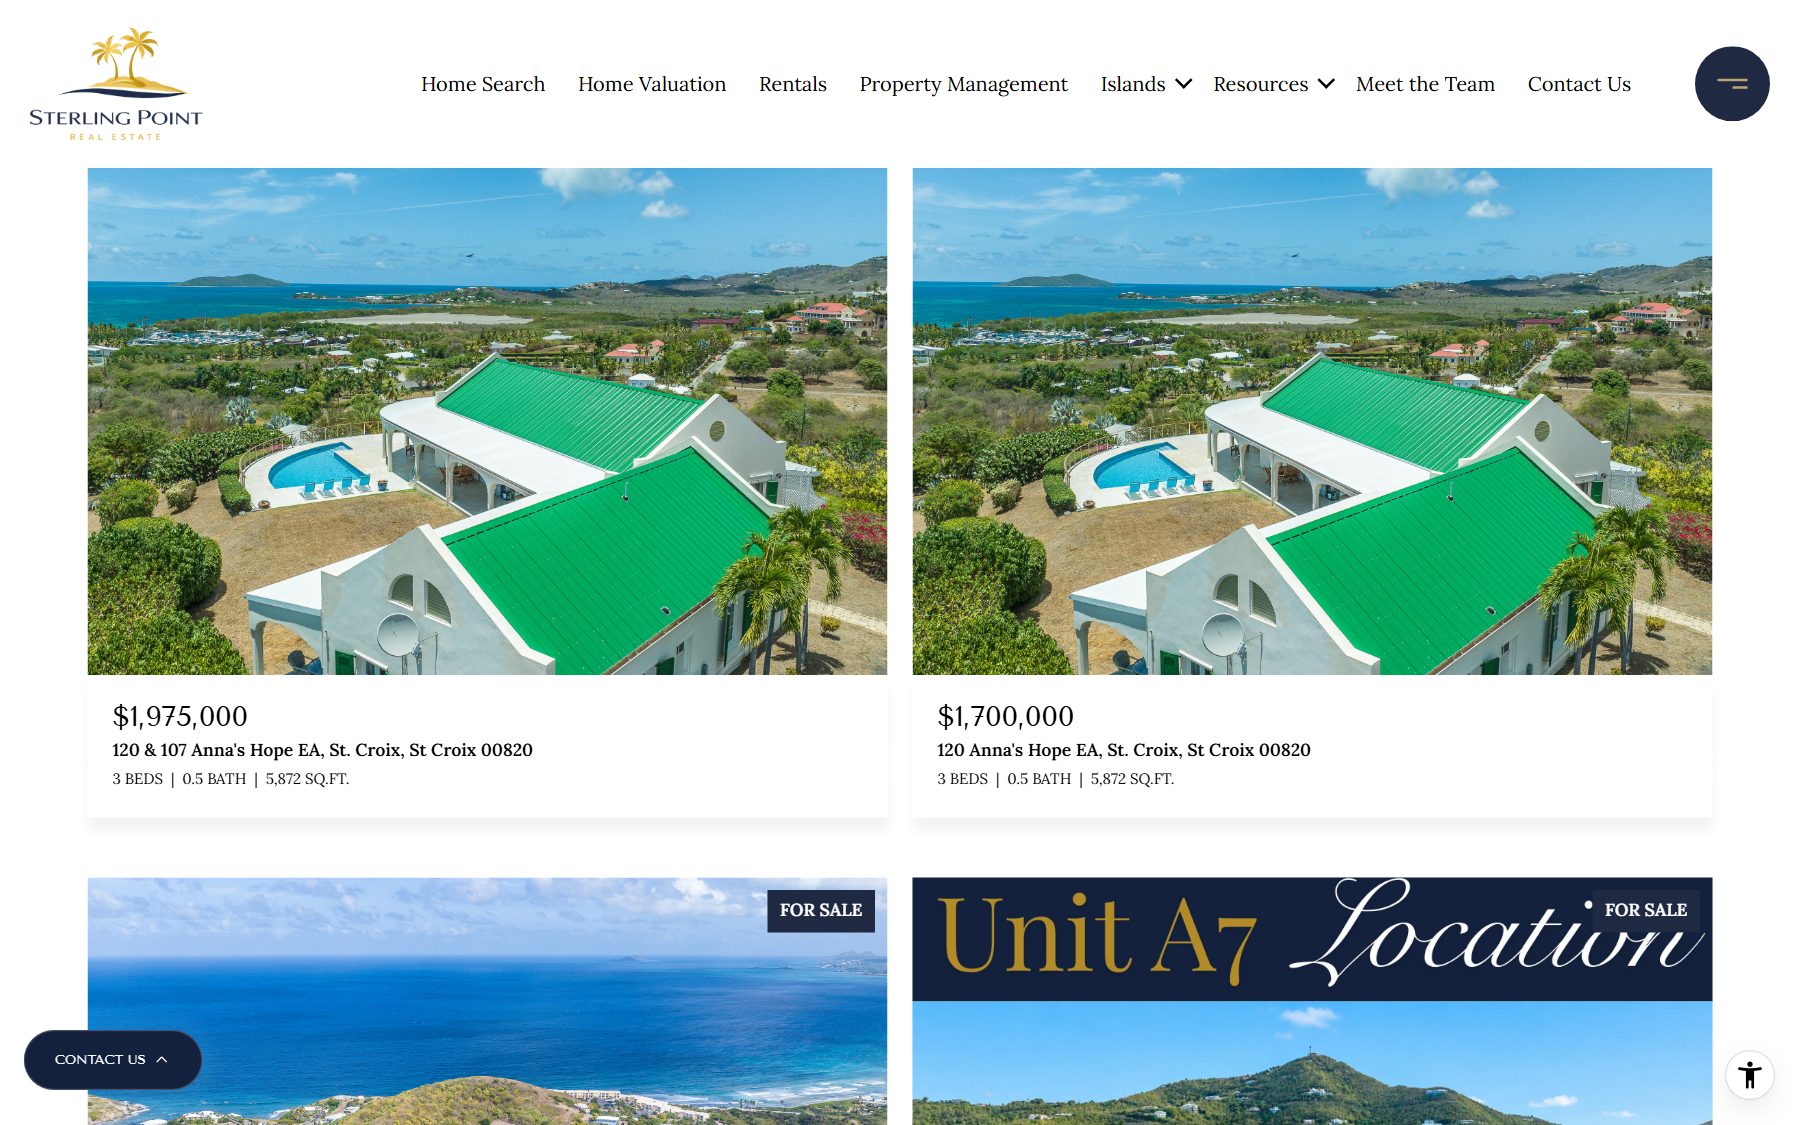
The medians rest on few sales and swing accordingly. A 71.6% rise in St. Croix's single-family median, on 57 sales against 46, may reflect which houses happened to sell more than any change in what a given house is worth. The quarter before went the other way: the same brokerage's first-quarter report put St. Croix's all-types median at $270,000, down 10% from $305,000, with an average of 251 days on the market. No 2026 sales figures for St. John were found, and none is given here.
The transfer tax turns those gaps into dollars. The territory's stamp tax is 2% on a price up to $350,000, 2.5% from $350,001 to $1,000,000, 3% from $1,000,001 to $5,000,000 and 3.5% above that, according to a summary of 33 V.I.C. section 121 published by LegalClarity on 14 June 2026, which calls them “flat rates per bracket, not marginal rates”. The statute itself was not read for this report. On that summary's bands, by our arithmetic, a sale at St. Croix's single-family median of $725,000 carries $18,125 of stamp tax. One at St. Thomas's $1,050,000 carries $31,500, because the higher price crosses into the 3% band. At the all-types medians the sums are $6,400 and $11,250. The summary says the split between buyer and seller is almost always set by the purchase agreement.
Professional managers and the break-up of the national firms
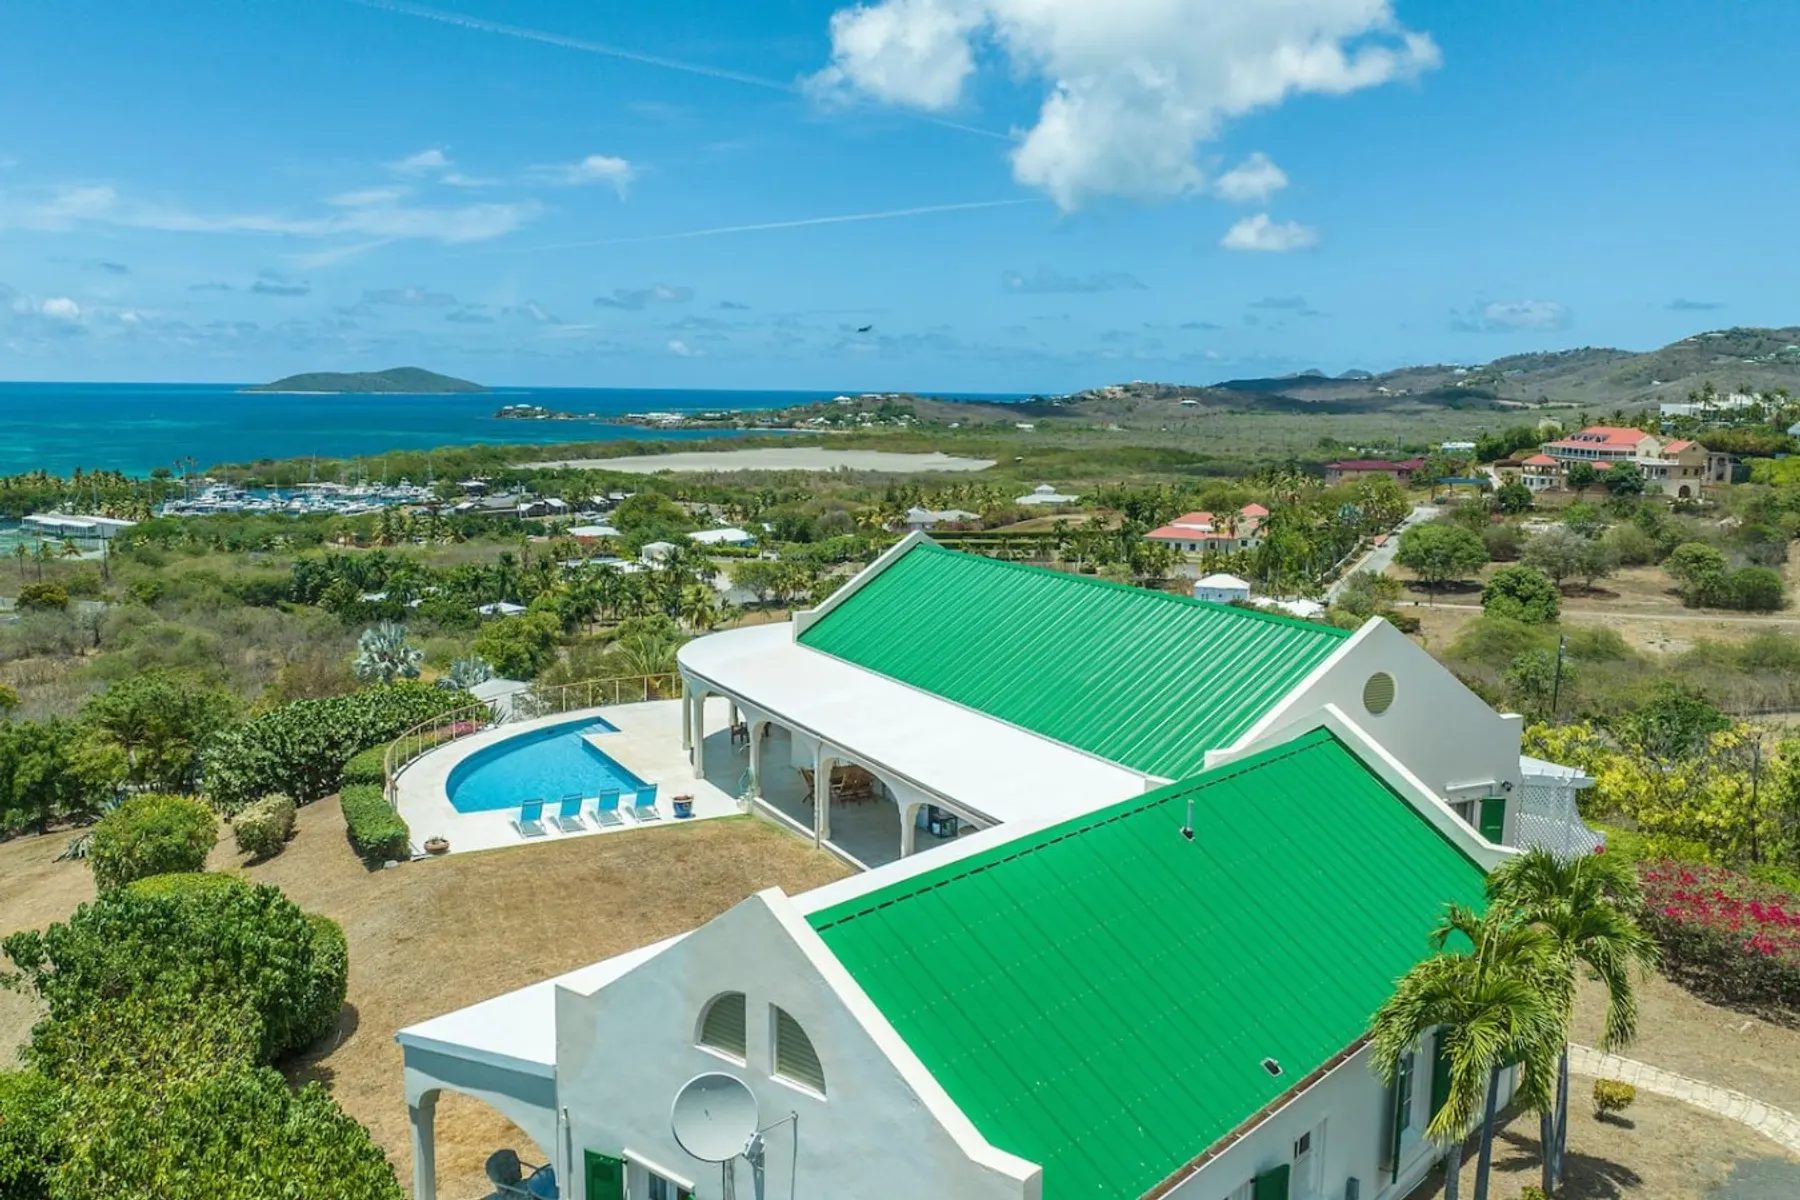
AirROI classes 11.0% of Christiansted's 438 listings as professionally managed and 39.3% as run by Airbnb superhosts. The definitions are the vendor's own. Comparable shares for St. Thomas and St. John were not gathered for this report, so the 11.0% describes one town and cannot rank the islands.
There is no official count to set beside it, because the territory does not license property managers. The Legislature passed a bill in June 2024 that would have created such a licence under the Real Estate Commission. Governor Bryan vetoed it, according to a Government House release of 11 July 2024, and told the Department of Licensing and Consumer Affairs to create a business-licence category for property managers instead. Whether that category now exists was not established for this report. Without a register, the share of rentals in professional hands on any of the three islands is whatever a listing scraper says it is.
Nationally the movement has been away from very large managers. Casago completed its purchase of Vacasa on 1 May 2025, and the combined group then managed more than 40,000 homes, Short Term Rentalz reported on 21 August 2026. By that date Casago said it had sold every former Vacasa market to local franchise owners, destination businesses or regional managers, with the last handovers due in September 2026. Its president, Joe Riley, described the aim as bringing management “back to local ownership”.
That is national context, and it proves nothing about the Virgin Islands. The sources read here do not say that any of those markets was in the territory.
The investment arriving on St. Croix
One resort project on St. Croix covers 150 keys. On 15 June 2026 VICI Properties and Club Med announced that VICI had bought the existing Carambola Beach Resort and leased it to Club Med on a long-term triple-net lease, with construction to begin in summer 2026, a reopening targeted for the fourth quarter of 2027 and about 200 direct jobs. The details are from the companies' release as carried by Hotel Online. VI Consortium reported the groundbreaking on 16 July 2026 and put the redevelopment at $75 million.
Against the bureau's figures the size is plain. St. Croix's reporting accommodations offered the equivalent of about 1,014 rooms a night in 2025, so 150 keys equal roughly 15% of that, on an island whose reported supply shrank 5.7% in the year. The table does not say whether the resort's rooms were inside the 2025 count, and while the rebuilding lasts they are out of use.
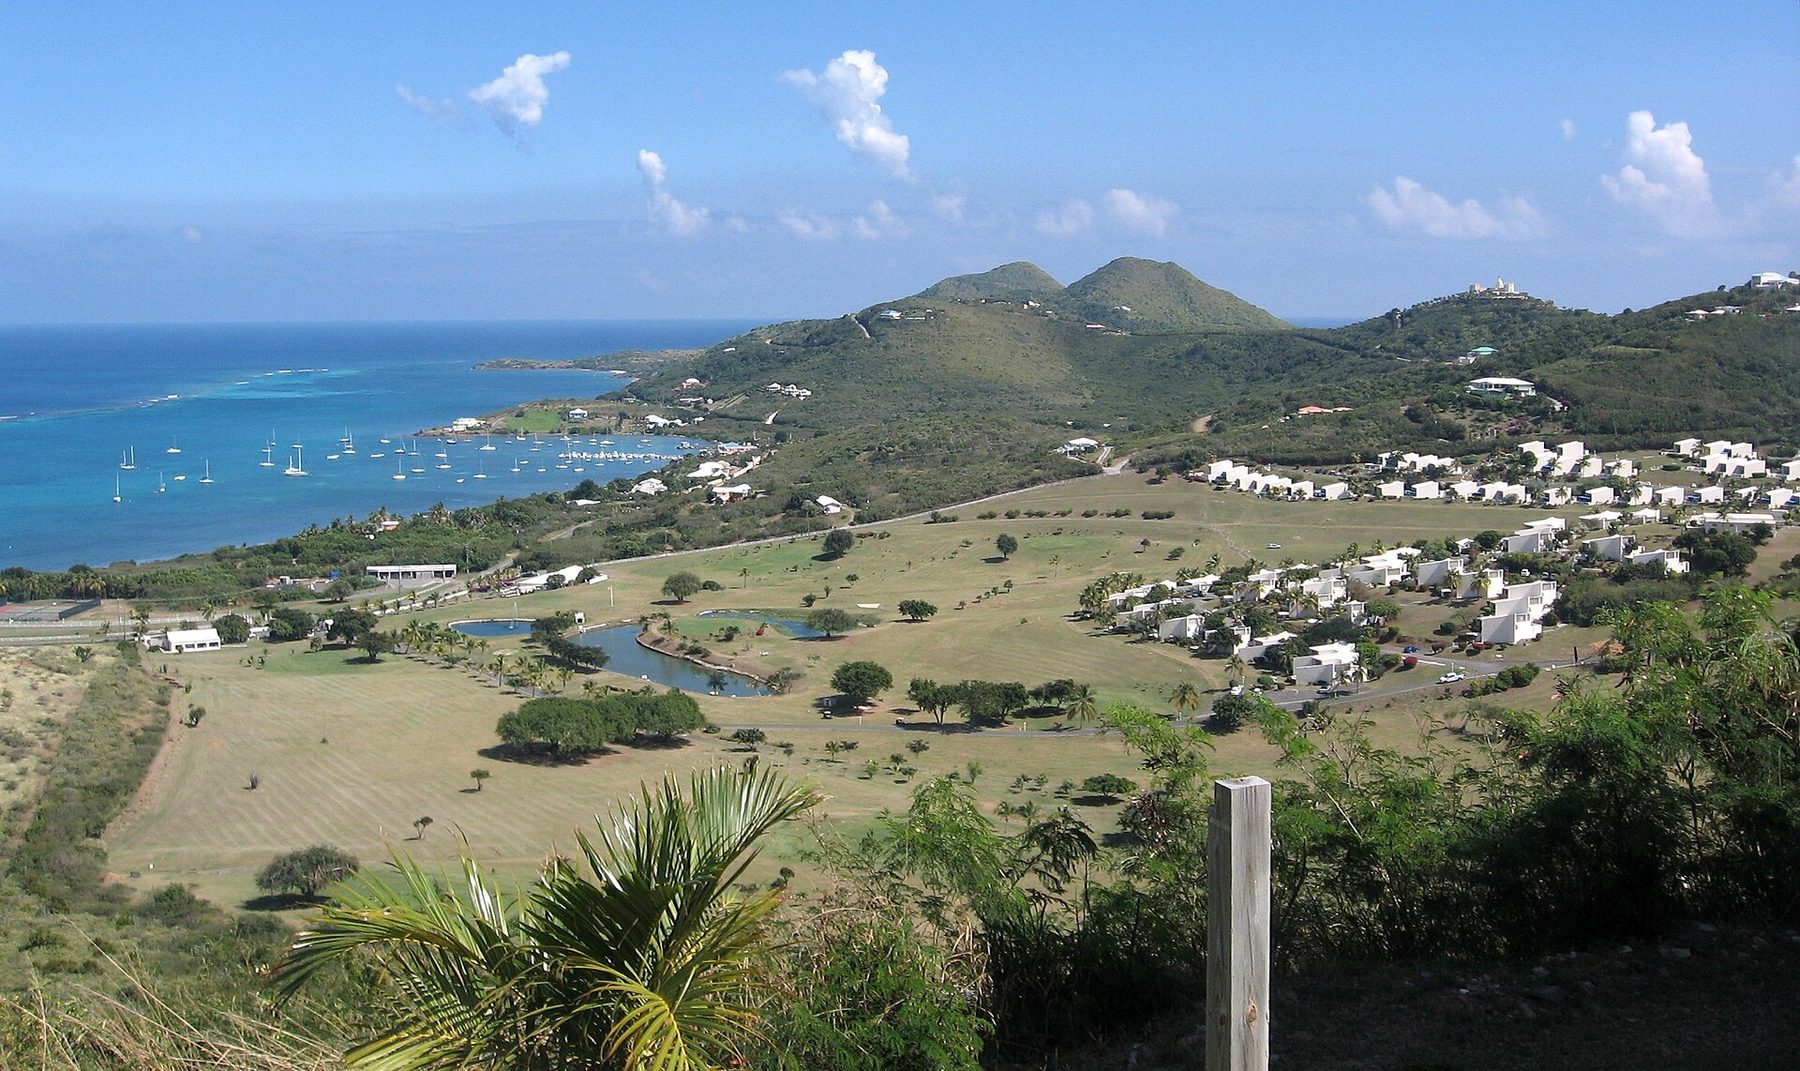
The effect on rental houses nearby is argued both ways, including by the firm used here for scale. In a post dated 20 August 2026, Sterling Point's blog wrote of rental property near the resort: “A large all-inclusive competing for the same beach travelers can cut demand as easily as it adds it.” That is a brokerage's opinion, and no data yet exists to test it.
The territory also courts businesses through tax. The Economic Development Authority's published incentives include a 90% reduction in corporate and personal income tax and a 100% exemption from gross receipts tax for approved firms, which must invest at least $100,000 and employ at least 10 full-time residents. Hotels and guesthouses are an eligible category, and St. Croix has its own South Shore Trade Zone. These are incentives for operating businesses. They are no tax break for buying a villa, and the home-price figures above should not be read through them.
One 13-home operator inside the totals
On 11 October 2026 SP Vacations' public listing feed held 13 homes with 38 bedrooms between them, sleeping 86 guests in all. The sums are ours. The company's own page counts five on the beach and eight with a private pool, in sizes from a one-bedroom condominium for two to a six-bedroom beach house for twelve. Most are around Christiansted and the East End, and one is on the west coast near Frederiksted.
The firm is new. Sterling Point Real Estate LLC and the trade name SP Vacations were registered on 30 January 2026, according to the territory's corporate register. The licence search of the Department of Licensing and Consumer Affairs, read on 11 October 2026, shows two business licences for the company, both on St. Croix and both running to 31 December 2026. Its team page lists four people. The owners are Nadja Boulger-Watrous, the principal broker and co-owner, and Rich Watrous, a co-owner who runs property management.
Set against the island's totals the business is small and easy to place. Thirteen homes compare with the 438 listings AirROI counts in Christiansted alone. A full year of 13 homes is 4,745 home nights, where St. Croix's reporting hotels and condominiums offered 369,949 room nights in 2025. With every bed taken the homes would hold 86 people, on an island that received between 13,034 and 21,543 air arrivals in each of the first eight months of 2026.
What cannot be placed is its performance. The company publishes no revenue, average rate or occupancy. The calendar count above is availability on one day. AirROI does not say which listings it classes as professionally managed. The figures in this report describe the market around the 13 homes and do not describe the homes.
What adding a second island would take
Two business licences, both on St. Croix, are what the Department of Licensing and Consumer Affairs register showed for Sterling Point on 11 October 2026. Sterling Point is a St. Croix brokerage that already describes itself as serving all three islands. Its home page says it serves clients “throughout the U.S. Virgin Islands”, and its site carries property search pages for St. Thomas and St. John. Its rental side has, so far, stayed on St. Croix, where all 13 homes are. Neither owner has published a statement about another island, and this report implies none.
The figures above describe what any St. Croix manager would find across the water. On AirROI's estimates the East End of St. Thomas averages $121 more a night than Christiansted at an occupancy 7.2 points higher, and Cruz Bay averages $423 more. Reporting accommodations in the other district ran 9.7 points fuller in 2025. The houses cost more as well: the median single-family sale on St. Thomas was $325,000 higher.
The cost side begins with distance, and it has a price: $85 one way or $150 return on the one passenger ferry between St. Croix and St. Thomas, as listed by the guide site GoToStCroix on 11 October 2026. The boat is out at 8:00 a.m. and back at 3:00 p.m. on six days a week, a crossing of 2 hours 10 minutes each way that leaves 4 hours 50 minutes ashore. St. John is a further ferry from St. Thomas, which the Department of Tourism lists at about 20 minutes and $8.15 one way.
Then come the costs per home and per place. The bureau's 2024 report gives the annual short-term rental licence as $260 for a home sleeping five or more and $195 for one sleeping up to four, and the 12.5% tax is filed monthly. The licence register is searchable by island, so a new office on St. Thomas or St. John would appear in it.
The rest is this report's reasoning and no statement by the company. Nobody can clean or repair a house on that timetable from another island, so the same service on a second one means a second payroll there, while booking software holds listings on any island in one account.
What the figures do and do not tell you
The firmest numbers here are the island columns of the BER's air arrivals table: 145,499 arrivals on St. Croix in eight months, up 6.7%, with the growth concentrated after May while the larger district slipped. The hotel figures are firm enough to say that St. Croix fills about ten points fewer of its rooms than St. Thomas and St. John and holds about a quarter of the territory's reported room nights. One brokerage's sales reports put St. Croix's medians below St. Thomas's in every category, with more sales and a longer wait.
What the figures do not tell you
St. John is inside the St. Thomas district in every government table used here, and no 2026 sale prices for it were found. The BER's files contradict each other on St. Croix's occupancy for 2024 and 2025 and are subject to revision. No government count of rental listings exists. The licence count is from 2023, and three vendors put St. Croix's rental occupancy at 29%, 36.6% and 58%. The home-price medians come from one brokerage and rest on as few as 27 sales. The stamp tax bands are from a secondary summary. The calendar count is one company's availability on one day. Insurance costs could not be sourced. Nothing here is a rate, an occupancy or an income for any single home.
Several dated items will test the picture. The bureau's September and October arrivals will show whether St. Croix's summer lead survives the low season. United's Newark flight begins on 31 October 2026. Club Med's reopening is targeted for the fourth quarter of 2027. The licence register will show, to anyone who searches it, whether any St. Croix manager has taken an address on a second island.
SP Vacations publishes its homes, its owners' pages and its guides at spvacationsvi.com, and the brokerage's listings are on a separate site. Its place in this report is arithmetic: 13 homes, 38 bedrooms and room for 86 guests, on the island that took a fifth of the territory's air arrivals in 2025 and all of its net growth in the summer of 2026.
Common questions
How many air arrivals did St. Croix have in 2026 compared with St. Thomas and St. John?
The Bureau of Economic Research counts 145,499 air arrivals on St. Croix from January to August 2026, up 6.7%, and 587,606 in the St. Thomas and St. John district, up 9.8%. In June, July and August St. Croix rose 14.8%, 8.8% and 26.2% while the other district fell 4.2%, 2.1% and 3.5%.
How does hotel occupancy on St. Croix compare with St. Thomas and St. John?
Table 1 of the bureau's December 2025 occupancy report, dated 9 March 2026, gives St. Croix 51.6% for 2025 and St. Thomas and St. John 61.3%. Another bureau file prints 50.3% for St. Croix, and all the figures are subject to revision.
How many short-term rentals are there on St. Croix?
No government count of listings exists. The bureau's 2024 report counts 464 licensed short-term rentals in the territory in 2023, 74 of them on St. Croix by our addition. Vendor estimates for St. Croix range from 598 listings in four areas (AirROI) to 861 (Airbtics) and 1,032 (BNBCalc).
Are homes cheaper on St. Croix than on St. Thomas?
On one brokerage's figures, yes. Coldwell Banker St. Croix Realty put the second-quarter 2026 median at $320,000 on St. Croix and $450,000 on St. Thomas across all types, and at $725,000 and $1,050,000 for single-family homes. St. Croix sales took a median 192 days against 127.
Do these figures show what any one rental home charges or earns?
No. The rental figures are vendor estimates for areas, the hotel figures cover accommodations that report to the bureau, and the company used for scale publishes no revenue, rate or occupancy. Its calendar count is availability on one day.
Sources
- U.S. Virgin Islands Bureau of Economic Research, Air Visitor Arrivals, January 2025 to August 2026 (A26-AUG) (24 September 2026).
- U.S. Virgin Islands Bureau of Economic Research, Monthly Hotel Occupancy Report 2025, December and year to date, Tables 1 to 4 (TABLE25-DEC) (9 March 2026).
- U.S. Virgin Islands Bureau of Economic Research, Hotel Occupancy Rates, January 2025 to June 2026 (H26-JUN) (July 2026).
- U.S. Virgin Islands Bureau of Economic Research, USVI 2024 Tourism Report and 2024 USVI Accommodations Report (August 2025).
- U.S. Virgin Islands Bureau of Economic Research, Cruise Passenger Arrivals, December 2025 (CP25-DEC) (February 2026).
- OPB / NPR, Spirit Airlines ceases operations after escalating financial struggles (2 May 2026).
- VI Consortium, Spirit Airlines prepares to shut down as rescue deal collapses, raising USVI travel concerns (1 May 2026).
- USVI Department of Tourism and United Airlines (PR Newswire), United Airlines announces new nonstop service linking St. Croix to Newark/New York (1 June 2026).
- AirROI, Airbnb market data for St. Croix, St. Thomas and St. John, by sub-market (updated 12 September 2026).
- AirROI, Christiansted, St. Croix: short-term rental market data, August 2025 to July 2026 (updated 12 September 2026).
- Airbtics, Airbnb revenue in St Croix, USVI: short-term rental data (updated 12 March 2026).
- BNBCalc, St Croix short-term rental market (as of October 2026).
- Airbnb Newsroom, U.S. Virgin Islands kick off Airbnb's first tax collection agreement in the Caribbean (24 May 2017).
- VI Consortium, Bryan proposes 20 percent Airbnb tax to tackle USVI housing shortage and boost hotel occupancy (23 March 2025).
- V.I. Bureau of Internal Revenue, Form 722 V.I., Hotel Room Tax return and instructions (revised May 2017).
- National Hurricane Center, Tropical cyclone climatology (read October 2026).
- Coldwell Banker St. Croix Realty, St. Croix Q2 2026 quarterly report (13 July 2026).
- Coldwell Banker St. Croix Realty, St. Thomas Q2 2026 quarterly report (13 July 2026).
- Coldwell Banker St. Croix Realty, St. Croix Q1 2026 Quarterly Report (23 April 2026).
- LegalClarity, USVI stamp tax: rates, who pays and exemptions (14 June 2026).
- Government House, U.S. Virgin Islands, Governor Bryan acts on bills passed in the 35th Legislature's June session (11 July 2024).
- Short Term Rentalz, Casago completes sales of former Vacasa markets (21 August 2026).
- Hotel Online, VICI Properties and Club Med announce acquisition and redevelopment of Carambola Beach Resort in St. Croix (15 June 2026).
- VI Consortium, Watch: Club Med breaks ground on $75 million St. Croix resort redevelopment (16 July 2026).
- U.S. Virgin Islands Economic Development Authority, Tax incentives (read 11 October 2026).
- V.I. Department of Licensing and Consumer Affairs, Public licence search (read 11 October 2026).
- Office of the Lieutenant Governor, Division of Corporations and Trademarks, Corporate and trade name register (Sterling Point Real Estate LLC; SP Vacations) (read 5 October 2026).
- GoToStCroix, QE IV ferry between St. Croix and St. Thomas (read 11 October 2026).
- USVI Department of Tourism, Getting to St. John via St. Thomas (read 11 October 2026).
- SP Vacations, About, owners and real-estate pages, public listing feed and availability search (read 11 October 2026).
- Sterling Point Real Estate, Home and team pages (read 11 October 2026).
- Sterling Point Real Estate, How to Turn a St Croix Condo Into a Vacation Rental (company blog) (23 April 2026).
- Sterling Point Real Estate, How Club Med St. Croix Could Affect Davis Bay Property (company blog) (20 August 2026).
A note on this story: Booked News's publisher works with SP Vacations on its marketing. The facts here come from the company's published pages and the public sources listed above. Sources were read on or before 11 October 2026. To report an error, write to the desk; see the corrections policy.

More features
 Photograph by Wilfredor, CC0, via Wikimedia Commons.Market report · ReturnsForeign Buyers in Rio's South Zone by the NumbersBy Callum Reid · 20 min read
 Photograph by Ekrem Canli, CC BY-SA 4.0, via Wikimedia Commons.Market report · OccupancySouth Maui Vacation Rentals in 2026 by the NumbersBy Amara Osei · 19 min read
 Photograph by Jason P. Heym, Seascape Pool Center, Inc. (Jpheym), CC BY-SA 3.0, via Wikimedia Commons.Market report · SupplySt. Croix's Winter in Numbers for Villas and HotelsBy Sunita Rao · 20 min read
Comments