Salem Halloween short-term rental bookings rise 22% as rates increase 25%
AirDNA data shows Halloween week bookings in Salem are up about 22% year over year, while average nightly rates have increased roughly 25%.
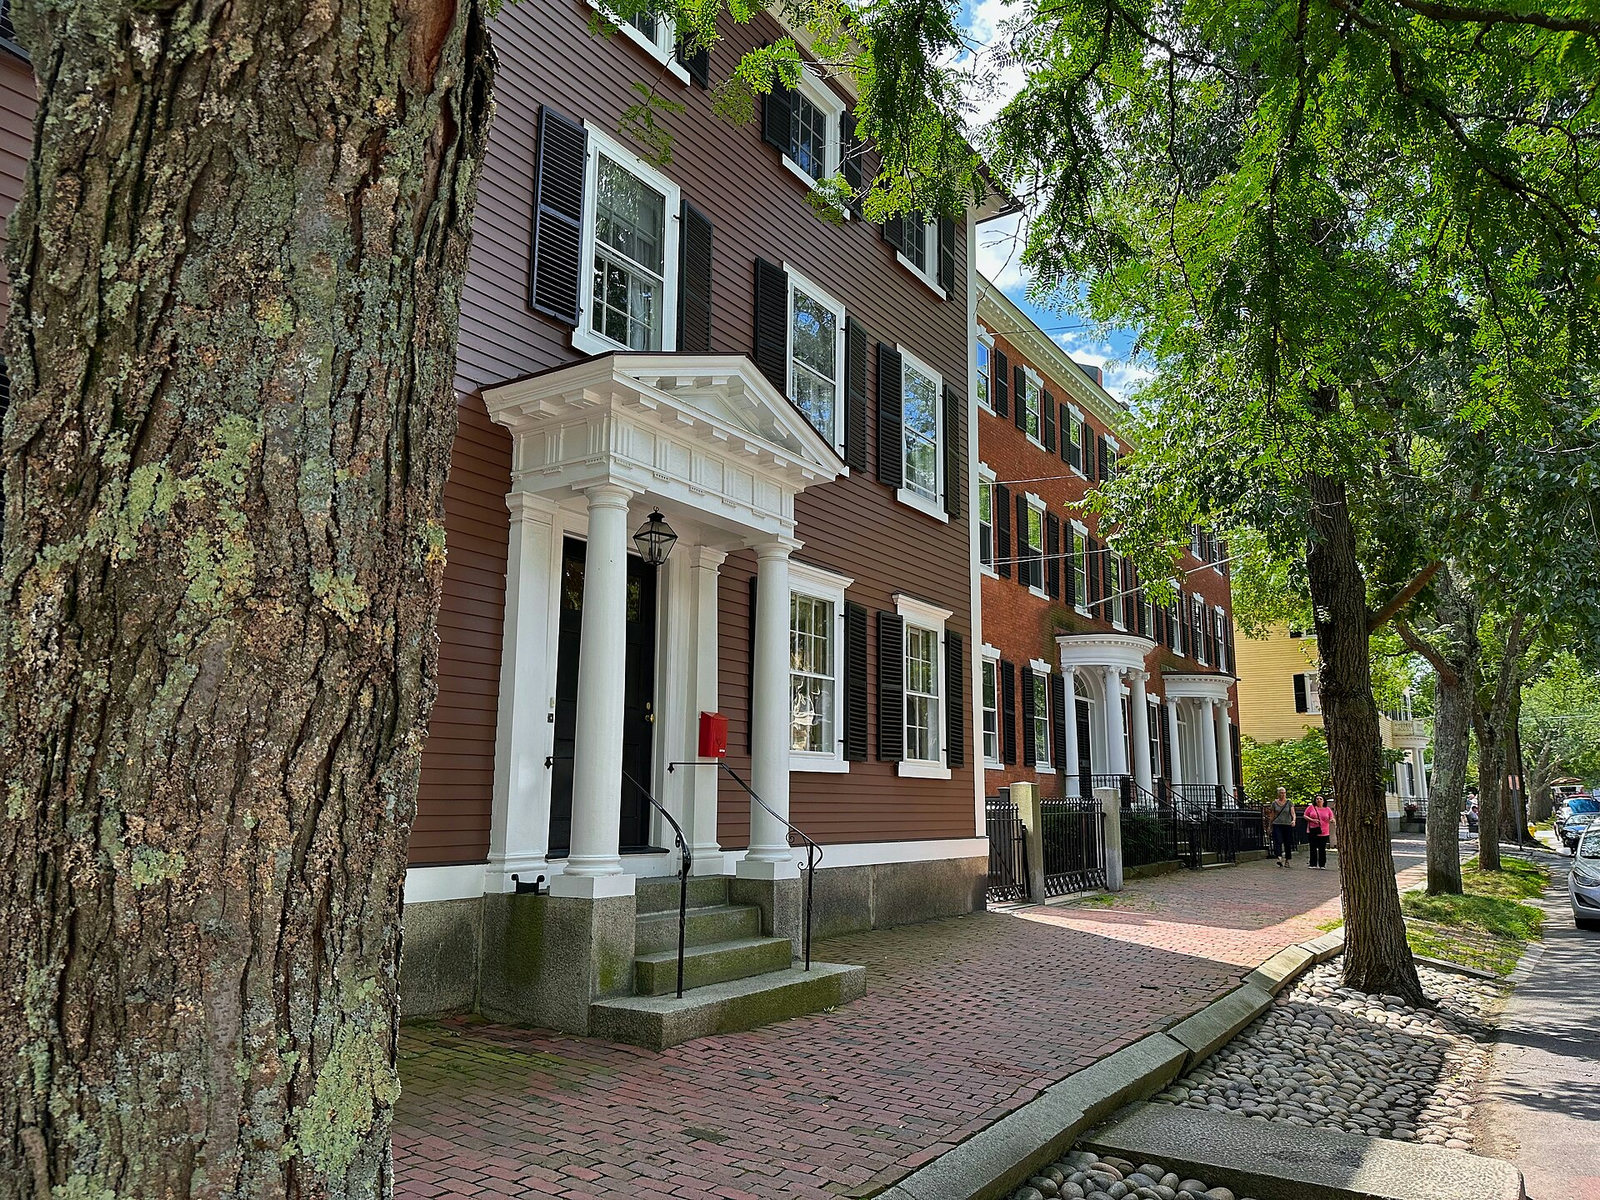
Historic residential houses on Chestnut Street in Salem, Massachusetts, photographed in 2023. Picture from Wikimedia Commons: “Chestnut Street Salem Massachusetts”. Photographer Perigrinator. Licence CC BY-SA 4.0. Resized from the original.
Guests have booked about 22% more nights in Salem for Halloween week than at this point last year, according to vacation rental data firm AirDNA. Average nightly rates across the same period are roughly 25% higher, driving a broader October expansion for local short-term rentals.
The growth in Salem reflects strong holiday compression as travel demand concentrates heavily around Halloween weekend across the regional short-term rental market.
What the data shows
AirDNA’s analysis of Salem short-term rentals shows strong gains across both booking volume and nightly pricing during the holiday period. The comparison evaluates Oct. 26 to Nov. 1 this year against Oct. 27 to Nov. 2, 2025, using reservation snapshots taken on Oct. 12, 2026 and Oct. 13, 2025, respectively.
Halloween falls on a Saturday this year, creating a sharp shift in booking patterns compared with the previous year. Bookings for Oct. 31 are up about 57% compared with the same Saturday last year. When comparing Oct. 31 with the exact calendar date last year, booked nights are up about 19% and average nightly rates are about 20% higher.
Demand growth extends across the full month. AirDNA reported that total October bookings in Salem are up about 17% compared with the prior year. Average nightly rates across the full month have increased about 18%. Combined, these rate and volume gains place total revenue on the books nearly 40% ahead of last year’s pace.
Historical data from AirDNA shows that Salem’s short-term rental market consistently maintains extreme occupancy levels around Halloween. Nightly occupancy on Halloween night topped 80% every year from 2022 through 2025. In three of those four years, Halloween night occupancy exceeded 90%.
Last year, occupancy reached about 93% on Halloween night in Salem. That figure was substantially higher than the weekly average, as occupancy averaged about 66% across the full week surrounding the holiday.
Revenue performance has historically varied based on the day of the week Halloween occurs. In 2022 and 2023, when Halloween fell on a Monday and Tuesday, respectively, revenue per available rental night in Salem more than doubled compared with the same weekday in nearby weeks. In 2025, when Halloween fell on a Friday, revenue per available rental night—also known as RevPAR—was about 20% higher than on other Fridays in the same period.
How it was measured
The data was compiled and analyzed by vacation rental analytics firm AirDNA, which tracks listings across short-term rental channels including Airbnb and Vrbo.
AirDNA based its findings on point-in-time reservation snapshots. The primary comparison evaluates bookings recorded by Oct. 12, 2026 for the stay period from Oct. 26 to Nov. 1 against bookings recorded by Oct. 13, 2025 for the stay period from Oct. 27 to Nov. 2, 2025.
The single-day comparison for Halloween night measures reservations for Oct. 31 against the equivalent calendar date and the equivalent day of the week from the previous year.
Full-month October comparisons examine total forward revenue, booked nights, and average daily rates on the books at identical calendar checkpoints year over year.
Calendar effects and booking pacing
Calendar shifts play a central role in driving the year-over-year percentage gains reported for Halloween night. AirDNA noted that the jump of about 57% in bookings for Oct. 31 compared with the same Saturday last year is partly attributable to a calendar quirk in 2025.
In 2025, Salem’s Halloween weekend saw its highest guest concentration on Thursday and Friday. The Saturday immediately following the holiday last year experienced lower demand, recording fewer bookings than any other Saturday from mid-September to early November.
This year, because Halloween itself falls on a Saturday, reservation pacing mirrors a typical high-demand October Saturday rather than a post-holiday slowdown.
Booking volume in Salem traditionally builds over a multi-week period leading into the holiday. Last year, booked nights climbed steadily each week starting in early September, reaching a seasonal peak during the week of Oct. 6.
Halloween week itself generated about 1,800 booked nights in Salem last year, demonstrating substantial total volume even when the holiday fell mid-week or on a Friday.
National comparisons and ghost tour markets
AirDNA evaluated short-term rental market performance across several U.S. destinations known for haunted history, ghost tours, and Halloween events to determine whether Salem’s demand spike is widespread.
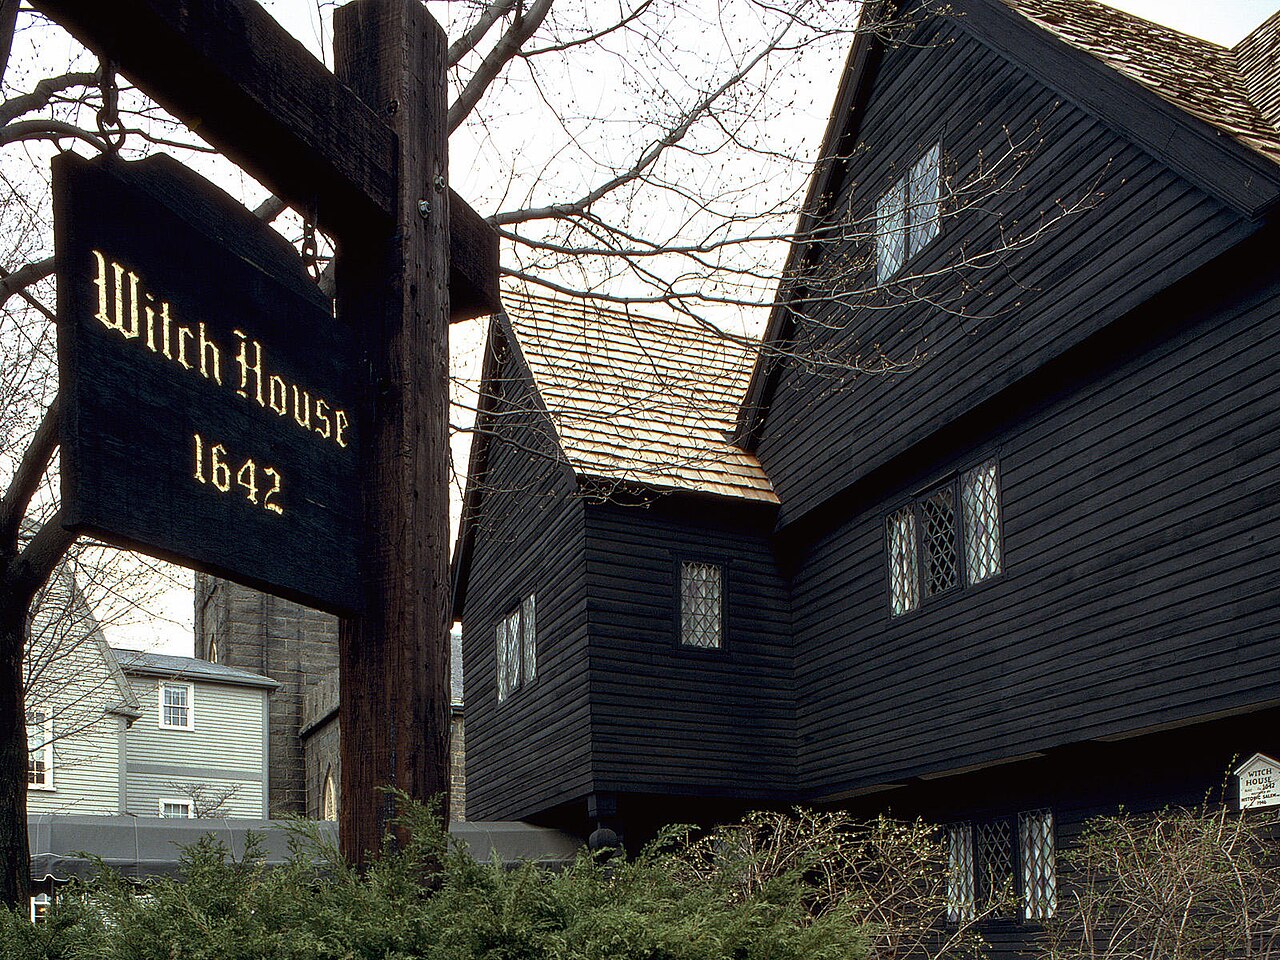
Among all markets analyzed, AirDNA identified only one other location with a comparable Halloween demand boost: the French Quarter in New Orleans.
In New Orleans’ French Quarter, occupancy ran between 62% and 63% when Halloween fell on a Monday or Tuesday in 2022 and 2023. Occupancy then rose to about 76% on a Thursday in 2024 and reached 82% on a Friday in 2025.
Revenue per available night in the French Quarter on Halloween was 88% above a typical Monday in 2022 and 75% above a typical Tuesday in 2023. However, when Halloween fell on a Friday last year, revenue per available night was about even with other Fridays during the same month.
For the current year, AirDNA found that Halloween week bookings in the French Quarter are roughly flat compared with last year. Despite flat booking volume, average nightly rates in the French Quarter are up nearly 30%.
AirDNA reported that other prominent heritage destinations known for ghost tours and haunted history did not exhibit a consistent Halloween demand boost. Markets showing no reliable holiday uplift included Savannah, St. Augustine, Gettysburg, Charleston, Williamsburg, Estes Park, and the Sleepy Hollow area.
Who it affects
The concentration of demand in Salem impacts operators, investors, guests, and local municipal management across the Massachusetts North Shore market.
For local short-term rental hosts and property managers, high compression during October creates opportunities to maximize revenue through strategic pricing adjustments. Properties located within walking distance of historic districts and event venues capture higher daily rates as available supply narrows.
For real estate investors, the concentrated seasonality of Salem emphasizes the role of regional event calendars in annual cash flow calculations. High revenue generated during October helps offset slower winter travel periods in coastal New England.
For prospective guests, tight market conditions mean earlier booking requirements and higher accommodation costs. With Halloween night occupancy historically exceeding 80% to 90%, travelers face constrained inventory as the holiday approaches.
What the figures do not tell you
While AirDNA’s forward booking data provides a snapshot of market demand, the figures leave out several operational and financial metrics.
The dataset measures advance bookings on specific snapshot dates (Oct. 12, 2026 and Oct. 13, 2025). It does not reflect final actualized occupancy or last-minute cancellations that may occur before stay dates arrive.
Top-line revenue and average nightly rates do not represent net profit for property hosts or managers. The figures do not incorporate platform listing fees, cleaning expenses, property management commissions, maintenance costs, or local lodging taxes.
AirDNA’s summary metrics do not separate performance by listing size, property type, or specific location within Salem. A small downtown apartment may experience different rate trends than a multi-bedroom single-family home in an adjacent neighborhood.
The data does not detail legal or regulatory compliance across the active listing pool, nor does it track direct bookings processed outside major online travel platforms.
What to watch
As the holiday travel window closes and full-month figures finalize, hosts and market analysts can track several operational metrics:
- Final occupancy rates recorded on Oct. 31 to measure whether Salem matches or exceeds last year’s 93% benchmark.
- Cancellation rates and late-booking activity during the final days leading up to Halloween weekend.
- Comparative RevPAR yields across different property size categories and proximity to downtown Salem.
- Post-holiday booking velocity for November to determine how quickly regional demand returns to baseline seasonal levels.
Figures checked by the standards desk (Paul Ostrowski): every figure in this story was matched to the source material listed below before publication.
Tally from the accuracy gate: 55 details tested, 54 found in the stored source, 1 allowed as background knowledge, nothing cut.
Is a figure here wrong? Say so / The corrections procedure and the log

Related stories
Weekend occupancy ran 62% higher than weekday levels in Cincinnati rentals

U.S. short-term rental RevPAR fell 0.6% in August 2026

European short-term rental rates rose 8.2% in July 2026 as occupancy steadied

U.S. short-term rental RevPAR rose 4.5% in June 2026
Read the desk every morning.
Leave your address for the Booked News briefing: the day's figures on rates, occupancy, demand, fees, supply and returns, each with its source, in one short email.
Comment thread