U.S. short-term rental occupancy fell 1.5% in October 2025
AirDNA reported that average occupancy fell to 54.0% as supply growth outpaced a 2.5% rebound in demand nights.

On November 18, 2025, the short-term rental analytics firm AirDNA reported that U.S. short-term rental occupancy fell 1.5% year-over-year in October 2025 to an average of 54.0%. This decline marked the second consecutive month of year-over-year occupancy drops for the domestic market, even as overall demand nights returned to growth with a 2.5% increase during the month.
The performance occurred against a backdrop of economic uncertainty, driven by a prolonged federal government shutdown that obscured official economic indicators and complicated the interest rate outlook. Despite these challenges, average daily rates rose 1.7% to $233.39, showing that short-term rental operators maintained pricing power even as occupancy edged downward.
What the data shows
The performance metrics for the U.S. short-term rental market in October 2025 presented a mixed landscape of growth and contraction. According to AirDNA, revenue per available rental increased 0.1% year-over-year to $125.97. This marginal increase occurred alongside a 3.2% rise in available listings, which reached a total of 1.75 million across the country. While the number of available properties grew, total demand nights booked also rose, posting a 2.5% increase compared to October 2024.
However, this demand growth was not distributed evenly enough to prevent occupancy from declining. The average occupancy rate for the month was 54.0%, representing a 1.5% decrease from the same period in the previous year. This was the second consecutive month of year-over-year occupancy declines, following a deeper drop of 3.6% in September 2025. Despite the drop in occupancy, operators succeeded in raising prices. The average daily rate rose 1.7% year-over-year to $233.39. Additionally, the Repeat Rent Index, which tracks nightly rates for existing operators and removes the influence of new listings, rose 0.5% year-over-year. Total nights booked during the month, however, fell 2.2% from October 2024.
How it was measured
The figures in this report were compiled and analyzed by AirDNA, a short-term rental data and analytics provider, and published on November 18, 2025. The data reflects performance metrics for the U.S. short-term rental market during the month of October 2025. AirDNA measures market performance by tracking listing activity, bookings, and pricing across major platforms such as Airbnb and Vrbo. The Repeat Rent Index is a proprietary metric designed to measure rental price changes for properties that remained active over a multi-year period, thereby controlling for changes in the quality and composition of new inventory entering the market.
In addition to its proprietary data, the AirDNA report incorporated macroeconomic indicators from external organizations. These included inflation figures from the Bureau of Labor Statistics, mortgage market data from Freddie Mac, employment estimates from the payroll processor ADP, and economic forecasts from Oxford Economics. The primary source did not publish the exact sample size of listings or the specific mathematical formulas used to calculate the Repeat Rent Index, nor did it provide a complete breakdown of the raw booking transactions analyzed for the month.
Macroeconomic factors and supply constraints
The broader economic environment in October 2025 was characterized by significant disruption. A prolonged federal government shutdown continued throughout the month, which delayed the release of official government economic data. This delay occurred at a critical juncture when the Federal Reserve was attempting to balance inflation concerns against a softening labor market. In the absence of official data, private payroll processor ADP estimated that while overall employment numbers rose in October 2025, private firms were shedding approximately 11,000 jobs per week during the final two weeks of the month. Oxford Economics forecasted that the U.S. unemployment rate would rise to 4.4% by the end of 2025, up from 4.3%, and remain near that level through much of 2026. Oxford Economics also warned that reduced payments and missed contracts from the shutdown could stall gross domestic product growth in the fourth quarter of 2025, though recent congressional actions to end the shutdown were expected to limit the damage.
Inflation also continued to influence the market. The Consumer Price Index rose 3.0% year-over-year in September 2025, marking the fifth consecutive month of increases. Although official inflation figures for October 2025 were delayed by the shutdown, economists assumed a continued slow upward trajectory. This inflationary pressure complicated the Federal Reserve's interest rate policy, as lowering rates too quickly to support the labor market risked driving mortgage rates higher. By the end of October 2025, Freddie Mac reported that the 30-year fixed mortgage rate had declined to 6.17%, its lowest level in a year, before nudging back up to 6.22% by November 6, 2025.
These high mortgage rates and high home values continued to suppress new short-term rental supply. Year-over-year supply growth remained at or below 4.1% throughout 2025. The supply growth rate of 3.2% in October 2025 was slightly higher than the 2.2% growth recorded in September, but it remained far below the gains of over 20% observed in early 2023. However, new listings broke a nearly two-year streak of year-over-year declines in October 2025, rising 2.8% compared to a decline of 3.2% in September. This marked a significant recovery from the lowest point of new listing activity in late 2024, which reached approximately negative 18%.
Shifting demand patterns and location performance
U.S. short-term rental demand remained resilient through most of 2025, with year-over-year growth recorded in every month except September, when a calendar shift involving the Labor Day weekend caused a temporary dip. In October 2025, demand nights returned to growth, rising 2.5% year-over-year. This recovery occurred despite a decline in international inbound travel. Following the announcement of tariffs in April 2025, international visits to the United States fell, particularly during the summer. Domestic travelers filled much of this gap, supported by a weaker U.S. dollar that made international travel more expensive for American residents.
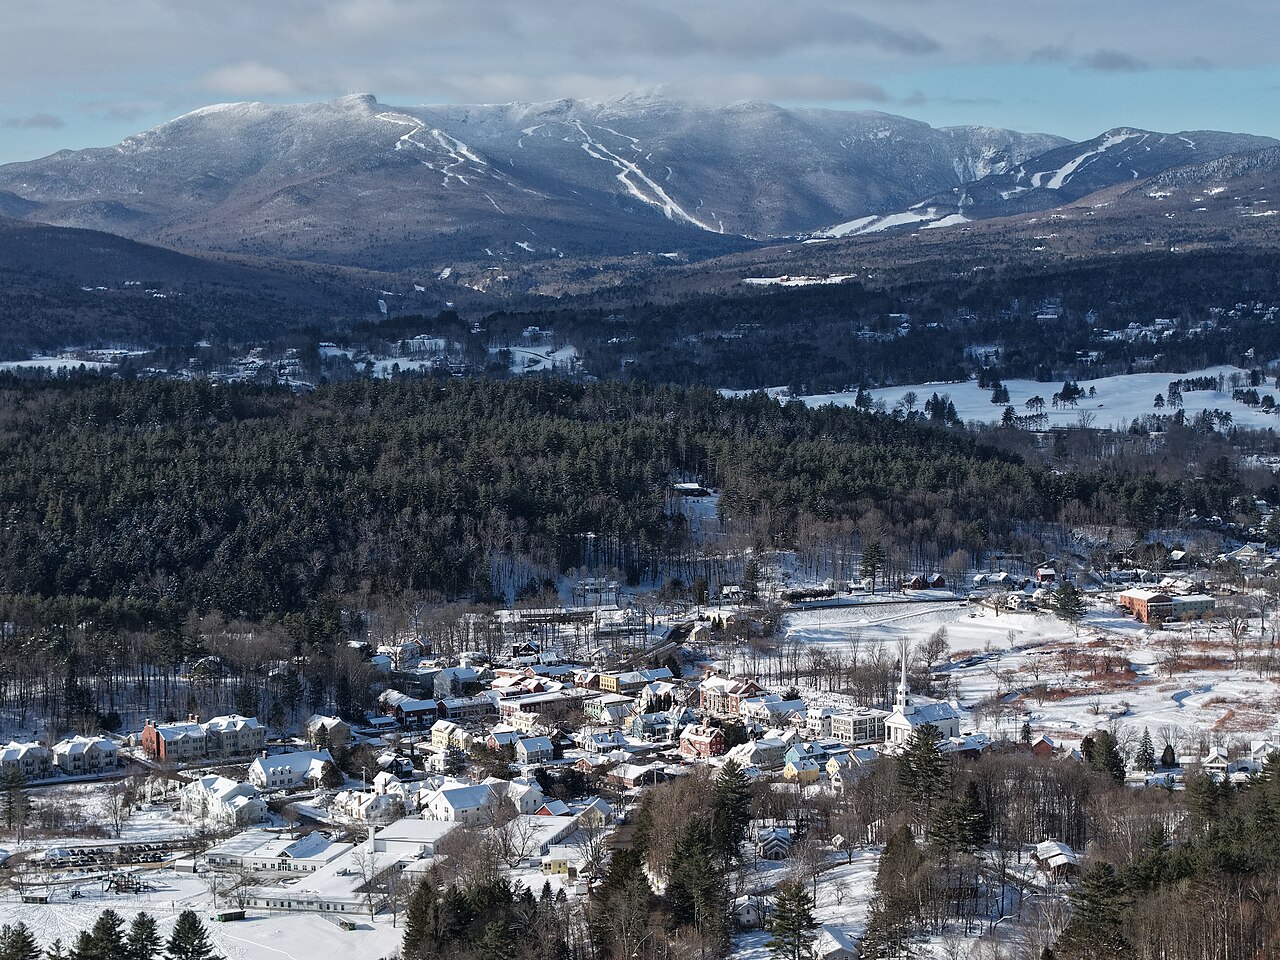
The performance of short-term rentals varied significantly by location type and price tier in October 2025. Mountain and Lake Resort markets were the only geographic segment to achieve occupancy growth during the month. In contrast, Small City and Rural areas experienced strong demand that was offset by rapid listing growth, which diluted average occupancy. Mid-Size Cities experienced slight demand declines combined with the second-fastest rate of supply growth, resulting in the steepest occupancy declines among all location types. This pattern mirrored summer trends, where resort destinations consistently outperformed other segments. Across price tiers, higher-priced properties continued to lead. Luxury listings were the only price tier to grow occupancy in October 2025, while lower-priced tiers experienced progressively larger occupancy declines, continuing a trend established during the summer.
Regional variation and regulatory pressures
At the regional level, short-term rental performance was highly fragmented, shaped by weather recovery, local regulations, and uneven supply dynamics. The most dramatic occupancy declines occurred in Florida, specifically in Sarasota and St. Petersburg, where occupancy fell by more than 20% year-over-year. AirDNA noted that this decline did not represent a sudden drop in demand, but rather a normalization from the previous year. In October 2024, both markets experienced temporary occupancy spikes as residents displaced by Hurricane Milton sought local short-term housing. With a quieter hurricane season in 2025, occupancy returned to typical seasonal patterns.
Other regions recovering from natural disasters showed different dynamics. In Cape Coral and Fort Myers, Florida, available listings rose 18.4% year-over-year as rebuilding efforts from Hurricane Ian progressed, but occupancy fell 8.4% as supply outpaced demand. Similarly, Maui, Hawaii, posted a 7.7% increase in listings and a 5.8% decline in occupancy as the island continued to recover from the 2023 wildfires and balance tourism with local environmental policies.
Local regulatory environments also exerted a strong influence on market performance. Cities with strict short-term rental regulations saw a contraction in supply, which benefited remaining operators. In San Francisco, California, available listings fell 5.8% year-over-year, while occupancy rose 9.8%. In Oakland, California, listings declined 5.7% year-over-year, and occupancy increased 6.5%. These localized movements highlight that national averages often masked significant regional differences driven by policy and weather events.

Pricing trends and holiday booking pacing
Average daily rates showed renewed strength in October 2025, rising 1.7% year-over-year after a 1.5% decline in September. The Repeat Rent Index also rose 0.5% year-over-year, indicating that established hosts were raising prices even when accounting for changes in inventory. The historical gap between average daily rates and the Repeat Rent Index, which widened in 2022 and 2023 when new listings entered the market at lower price points, continued to narrow in 2025. This alignment suggests that newer listings are pricing themselves in line with existing inventory, reducing price divergence across the market.
Forward-looking booking data for the holiday season showed a divergent outlook. Travel planning for November 2025 appeared to be affected by the government shutdown and associated air travel delays, with November booking pacing up only 1.7% year-over-year. However, the outlook for the end of the year was much stronger. Because Christmas and New Year's Day fell in the middle of the week in 2025, travelers booked longer holiday stays. Booking pacing for December 2025 and January 2026 was up nearly 8% year-over-year. Thanksgiving pacing remained 7% to 9% above the previous year, a decline from the 15% growth projected a month earlier, but still representing solid demand.
Specific holiday dates showed substantial growth compared to 2024. Bookings for Christmas Eve were up 12%, and Christmas Day bookings rose 14%. New Year's Eve bookings increased 17%, while New Year's Day bookings rose 21%. Among the top ten largest U.S. markets, Austin, Texas, recorded the highest year-over-year demand growth for Thanksgiving at 17.2%. Other major Thanksgiving destinations showing strong pacing gains included Orlando, Florida, with a 14.2% increase, and Gatlinburg and Pigeon Forge, Tennessee, with a 15.8% increase. Some smaller markets experienced massive demand spikes driven by shifting college football schedules, including Ann Arbor, Michigan, where booking pacing rose 84.9%, and Gainesville, Florida, which saw an 80.5% increase. Asheville, North Carolina, also recorded a 62.8% increase in holiday bookings, recovering from the prior year's impact from Hurricane Helene.
What to take from it
For short-term rental operators and investors looking back at the October 2025 performance, several key lessons emerge for managing properties in a shifting economic landscape:
- Compare local listing growth against occupancy trends rather than relying solely on national demand figures, as rapid supply additions can easily dilute local performance.
- Monitor the relationship between average daily rates and the Repeat Rent Index to understand if new inventory is undercutting established hosts or if pricing is stabilizing.
- Watch regional regulatory shifts closely, as strict rules in cities like San Francisco and Oakland can artificially suppress supply and boost occupancy for remaining operators.
- Track forward-looking holiday pacing closely, as calendar alignments like mid-week holidays can create longer, high-value booking windows that require early dynamic pricing adjustments.
Figures checked by the standards desk (Paul Ostrowski): every figure in this story was matched to the source material listed below before publication. The desk's review found nothing to correct.
Sources
- AirDNA - published November 18, 2025.
Part of the Booked News record for November 2025. The desk filed this story on October 9, 2026 from a source published in the month it covers, under the same figure rule as the daily news.
Report an error in this story · Corrections policy and log

Related stories

U.S. short-term rental rates rose 6.9% in July 2026 as supply growth flattened

U.S. short-term rental RevPAR rose 4.5% in June 2026

U.S. short-term rental occupancy rose to 57.2% in May 2026

U.S. short-term rental supply growth accelerated to 3.5% in April 2026
Read the desk every morning.
Leave your address for the Booked News briefing: the day's figures on rates, occupancy, demand, fees, supply and returns, each with its source, in one short email.
Comments