Fall short-term rental reservation nights projected to crack 100,000 as regional demand grows
AirDNA projects northern Michigan fall reservation nights will top 100,000 as budget-conscious travelers seek closer-to-home seasonal trips and direct bookings.

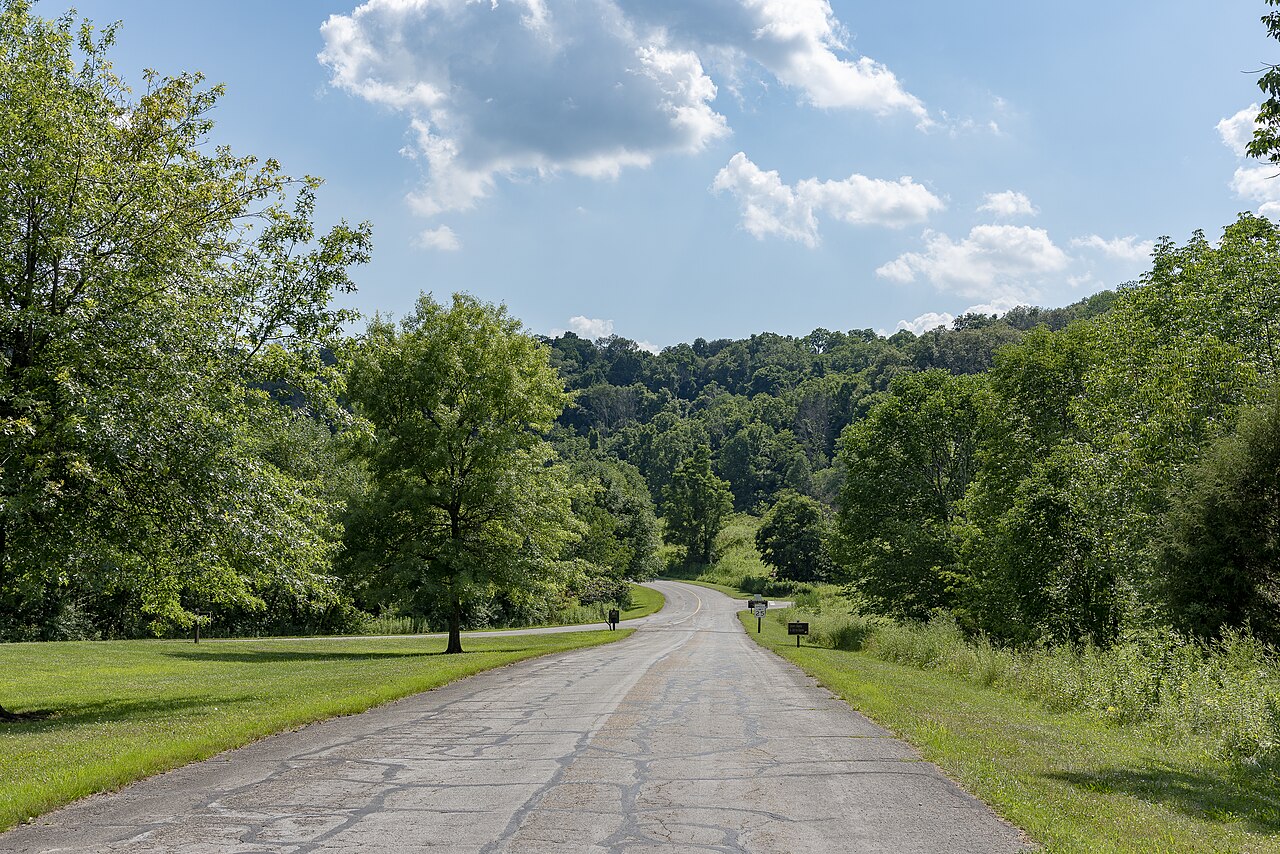
The wooded landscape of Briar Hill in northwest Lower Michigan, photographed in 2017. Photo: “Briar HIll (Michigan)” by RomanKahler, licensed CC BY-SA 4.0, via Wikimedia Commons. Resized from the original.
Short-term rentals across the northwest Lower Michigan region are projected to crack 100,000 reservation nights for the 2026 fall color season, according to data from AirDNA. The projected benchmark marks a growth of roughly 37 percent from four years ago, signaling a sustained consumer pivot toward regional drive-to destinations as economic factors prompt travelers to adjust their seasonal itineraries.
As inflation and gasoline costs remain elevated, leisure travelers are re-evaluating long-haul transit in favor of closer regional trips. This shift is reshaping seasonal booking patterns across drive-to leisure markets in the United States, providing a substantial demand buffer for property managers and hosts during traditional shoulder months.
How the metric works
Regional drive-to demand measures guest stays in non-urban, regional markets accessible primarily by passenger vehicle rather than commercial air travel. In short-term rental analytics, regional market performance reflects consumer sensitivity to total trip expenses, including fuel costs, accommodation fees, and local activity prices. Drive-to destinations rely heavily on feeder markets located within a short drive. For example, operational records for regional vacation rentals show typical feeder distances ranging from a 30 minutes drive to local tourist spots up to about 1.5 hours by car from major city centers.
When macroeconomic pressures compress household travel budgets, drive-to regional markets often experience demand surges relative to high-cost flight destinations. Bram Gallagher, director of economics and forecasting for AirDNA, noted that outdoor recreational travel serves as an affordable alternative for consumers looking to reduce vacation expenses. Traveling closer to home allows leisure guests to maintain holiday schedules while limiting exposure to elevated transportation costs.
Across 19 fall foliage markets in the eastern and midwestern United States, AirDNA reported that reservation nights booked for the fall color season are pacing 9.8 percent ahead of last year. Regional growth is led by the Appalachian South, where reservation nights increased 15 percent year-over-year. In northwest Lower Michigan, fall color weekend bookings for three consecutive weekends are pacing 10-20 percent ahead of last year, absorbing demand spillover as traditional New England foliage markets reach total capacity.
This seasonal influx fundamentally alters the annual demand distribution for regional vacation rentals. In northern Michigan, fall now accounts for 11.2 percent of total short-term rental activity, whereas peak summer accounts for 46 percent. This shoulder-season expansion provides crucial revenue continuity in years when peak summer performance softening occurs. During August 2026—the region's peak month—active listings fell 1.8 percent year-over-year from 8,990 to 8,829, while monthly booking nights dropped from 151,387 to 144,701. Strong autumn demand helps offset those mid-year declines.
How it was measured
The regional demand metrics and seasonal forecasts cited in this analysis originate from market tracking conducted by AirDNA and consumer survey data collected by Savvy.
AirDNA evaluated short-term rental reservation nights, listing counts, and historical performance across 19 fall foliage markets in the eastern and midwestern United States, as well as a specific 10-county region in northwest Lower Michigan. AirDNA defines the fall color season window as September 29 to November 8. Historical benchmarks for the 10-county Michigan region track the growth trajectory across several autumn seasons:
- October 2019: 5,273 active listings, 36,531 reserved nights, and $7.9 million in total revenue.
- Fall season 2022: Approximately 73,000 reservation nights.
- Fall season 2023: 80,000 reservation nights.
- Fall season 2024: 90,000 reservation nights.
- Fall season 2025: 92,500 reservation nights, with October 2025 specifically reaching 8,332 available listings (a 58 percent increase over 2019), 78,517 reservation nights (up 115 percent over 2019), and $23,575,887 in total revenue (up 198 percent over 2019).
- Fall season 2026: Projected year-over-year uptick of about 8.5 percent, with October 2026 alone projected at 84,629 reservation nights and the full seasonal window expected to exceed 100,000 reservation nights.
To measure consumer booking choices and fee sensitivity, direct booking marketplace Savvy conducted a survey of 1,002 database respondents in September 2026. The survey evaluated travel intent, accommodation budgeting, and channel selection for leisure trips planned between October 2026 and February 2027.
Drivers of regional demand shifts
Consumer travel patterns in regional markets are primarily driven by accommodation budgets and total cost control. In the Savvy survey, more than 70% of respondents confirmed plans to take a leisure trip between October and February. However, rising lodging costs and service charges are forcing guests to implement specific cost-saving measures.
When establishing travel budgets, nearly 64% of surveyed travelers plan to spend about $2,500 on accommodations per trip. To manage these expenses, consumers report adopting four primary strategies:
- 43.7% cite booking directly with a hotel, vacation rental company, or host as their primary cost-saving strategy.
- 40% choose to travel during off-peak periods to avoid peak pricing.
- 38.6% actively avoid platforms with high service fees.
- 37.9% utilize deal or discount sites to identify lower rates.
Because transportation and lodging represent the largest single line items in a leisure budget, fuel prices and platform service fees heavily influence guest conversion rates. When gas prices remain high, guests shorten their travel distances and seek to eliminate ancillary fees on the lodging portion of their stay.
Platform fees and pricing transparency
Price transparency directly governs consumer platform selection. The Savvy survey revealed that 81% of travelers encountered surprise fees when booking short-term accommodations on traditional online travel agencies (OTAs) such as Airbnb or Vrbo. As a result, transparent total pricing has become a primary booking condition.
When asked what factors influence where they choose to book a vacation rental, 49.48% of survey respondents identified lowest total price as their primary decision factor, while 36.33% cited transparent pricing without additional fees. When given the opportunity to eliminate platform charges, guest loyalty to major OTAs decreases significantly:
- More than 67% of surveyed travelers stated they are very likely to switch from traditional OTAs to a direct booking platform if they could save about 15% per trip.
- Savvy reports that direct booking models with zero service fees across its database of more than 150,000 professionally managed properties can save travelers up to 20% per booking.
For short-term rental operators, these findings show that mandatory platform service fees created by major online travel channels represent a growing source of booking friction, particularly among budget-conscious regional travelers.
Operational economics for hosts and managers
Capturing regional shoulder-season demand requires property managers to carefully balance operational expenses, seasonal pricing strategies, and local regulatory constraints.
Operational records from regional vacation rental launches highlight the upfront cost structure required to bring inventory online. In a published record detailing a rural vacation rental startup in Japan's Kansai region—located 500m from a beach and within driving distance of regional centers—the setup process spanned about 2 months from concept to welcoming the initial guest on July 27th following notification acceptance on July 19th. Initial setup capital expenditures included:
- Startup commission to a management company: approx. 250,000 yen.
- Fire safety equipment installation: approx. 150,000 yen.
- Furniture and consumables procurement: approx. 700,000 yen (600,000 yen initial spend plus 100,000 yen post-opening additions).
- Listing photography: approx. 100,000 yen.
Operational constraints can also limit annual operating days. Under Japan's Private Lodging Business framework, properties are subject to a strict 180-day annual limit. The operating host noted that attempting to operate beyond demand peaks by heavily discounting rates during low-demand periods significantly reduces net profit margins while increasing labor. In drive-to regional markets with defined seasonal windows, operators must maximize gross revenues during demand peaks—such as autumn leaf peeping—rather than chasing low-margin occupancy during deep off-peak periods.
What to watch
Operators looking to optimize regional short-term rental inventory during seasonal demand shifts should monitor specific market signals:
- Track local regional booking pacing against historical regional benchmarks established by analytics providers like AirDNA.
- Evaluate fee structures on direct booking channels relative to major OTA commission charges to capture price-sensitive regional guests.
- Monitor shoulder-season drive-to traffic patterns and local tourism indicators during seasonal windows such as foliage periods.
- Adjust minimum night stay requirements during fall weekend spikes to maximize yield during high-demand regional periods.
Figures checked by the standards desk (Paul Ostrowski): every figure in this story was matched to the source material listed below before publication.
Checked by the accuracy gate: 102 specifics checked, 92 traced to the source material, 10 general background, none removed.
Sources
- note - The complete record of opening my first vacation rental at my parents' villa. About 2 months from the initial idea to the first guest, the first hurdle was the public health ... (October 17, 2026).
- The Ticker - Northern Michigan's Short-Term Rentals Are Tracking Toward Their Busiest Autumn Season Ever (October 11, 2026).
- Yahoo Finance - As Vacation Rental Booking Platforms Evolve, Holiday Travelers Are Rethinking How They Book (October 5, 2026).
An analysis column by the Booked News desk. Every figure is taken from the sources above.
Report an error in this story · Corrections policy and log

Related stories

Northern Michigan Fall STR Bookings Track Toward Record 100,000 Reservation Nights


UAE rental bookings paced 13% behind in the third quarter of 2026 as supply shrank
European short-term rental rates rose 8.2% in July 2026 as occupancy steadied
Read the desk every morning.
Leave your address for the Booked News briefing: the day's figures on rates, occupancy, demand, fees, supply and returns, each with its source, in one short email.
Comments