U.S. ski markets pace ahead in short-term rental revenue for 2026–27 season
KeyData reports adjusted RevPAR is pacing ahead in 14 of 19 U.S. ski destinations, driven by occupancy gains in Taos, Killington, and Mammoth Lakes.
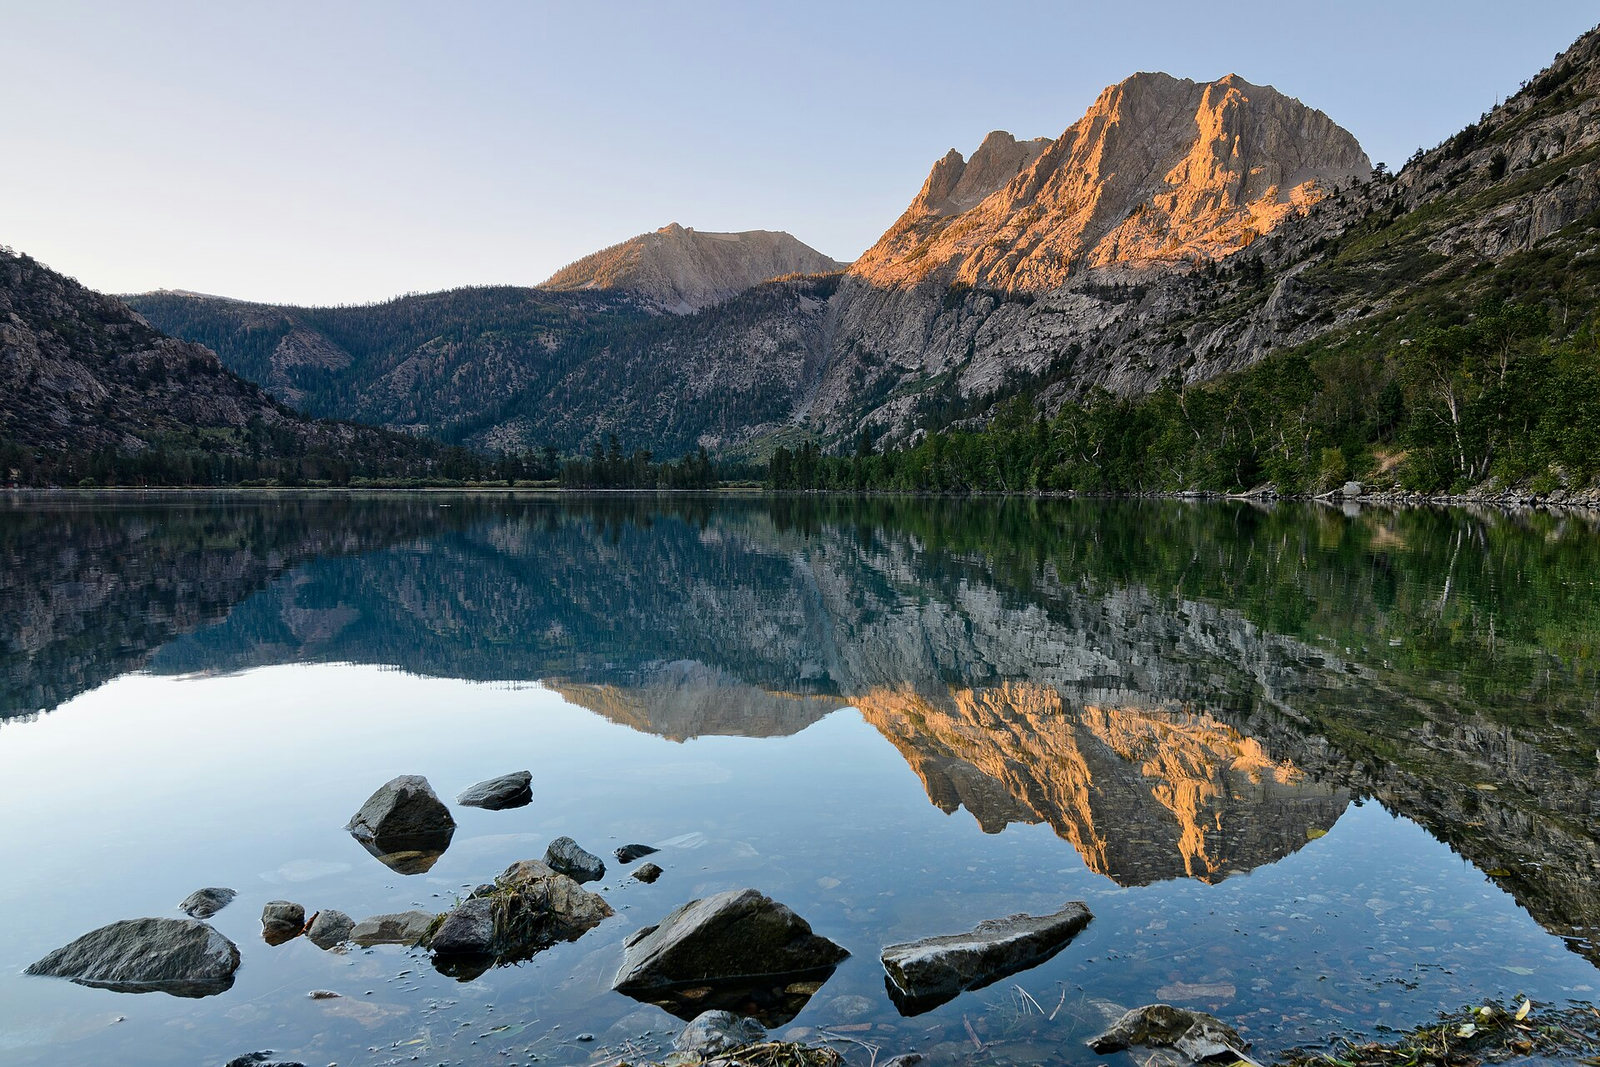
Silver Lake in Mono County near Mammoth Lakes, California, photographed in 2016. Picture from Wikimedia Commons: “Silver Lake Mammoth September 2016 001”. Photographer King of Hearts. Licence CC BY-SA 4.0. Resized from the original.
Adjusted revenue per available rental is pacing ahead of last year in 14 of 19 U.S. ski destinations analyzed by KeyData as the 2026–27 winter season approaches. Early pacing data tracked by the lodging intelligence platform shows that higher adjusted paid occupancy is driving the growth across most markets, even as pricing strategies diverge widely between regional destinations.
The pacing data, published by KeyData on October 28, 2026, reflects short-term rental reservations on the books for the ski season spanning November through April. While several destinations in New Mexico, Vermont, California, and Colorado report significant percentage gains in year-over-year revenue metrics, five major Rocky Mountain ski markets are trailing their performance from the same point last year.
What the data shows
According to KeyData, adjusted revenue per available rental (RevPAR) is pacing ahead of last year in 14 of 19 U.S. ski markets evaluated in its winter outlook. The growth is led by Taos, NM, where adjusted RevPAR is pacing +88% ahead of the same period last year. KeyData reported that Killington, VT, follows with adjusted RevPAR pacing +68% ahead, while Heavenly, CA (+49%), Mammoth Lakes, CA (+48%), and Aspen, CO (+44%) also show substantial year-over-year gains in adjusted RevPAR.
Much of this revenue performance is driven by gains in booking volume rather than increased room rates. KeyData recorded that Taos, NM, has adjusted paid occupancy pacing 87% ahead of last year, moving from 4.2% to 7.8%, while average daily rate (ADR) remains nearly flat. In Killington, VT, adjusted occupancy is pacing 63% ahead at 10.3%, up from 6.3% last year, accompanied by a 3% increase in ADR. Aspen, CO, shows adjusted occupancy pacing 44% ahead, rising from 5.4% to 7.8%, while ADR is essentially unchanged.
KeyData noted that these percentage gains occur from a relatively low absolute occupancy base early in the booking cycle. For example, while Taos, NM, shows an 87% year-over-year increase in adjusted occupancy, only 7.8% of paid nights are currently occupied on the books for the upcoming season.
Conversely, five markets analyzed by KeyData are pacing behind last year in adjusted RevPAR, all located in the Rocky Mountain region. KeyData found that Steamboat Springs, CO, is furthest behind with adjusted RevPAR down -13.5%, followed by Winter Park, CO (-12.3%), Park City, UT (-11.9%), Summit and Eagle County Ski Areas, CO (-9.1%), and Jackson Hole, WY (-7.6%).
How it was measured
The figures were compiled and published by KeyData, a lodging intelligence platform that tracks direct reservation data from vacation rental management systems and short-term rental platforms. KeyData measured pacing performance for the 2026–27 ski season, defined as the six-month period from November through April, across 19 selected U.S. ski destinations.
Pacing compares active bookings on the books as of late October 2026 against reservation totals captured at the exact same point in 2025 for the 2025–26 ski season. The primary metrics measured include adjusted RevPAR, adjusted paid occupancy, and average daily rate. KeyData calculates adjusted RevPAR and adjusted paid occupancy by accounting for available owner and guest nights to reflect available rental supply across property management portfolios.
Occupancy gains and rate trade-offs
The pacing data reveals that higher room rates are not driving the destinations that lead overall revenue growth. In several markets, property managers are using lower average daily rates to generate higher occupancy, resulting in positive net RevPAR growth.
KeyData reported that Mammoth Lakes, CA, has adjusted occupancy pacing 58% ahead, moving from 4.7% to 7.4%, despite ADR declining 6.5%. In Stowe, VT, adjusted occupancy is up nearly 50%, rising from 5.9% to 8.8%, while ADR is down 7%. Sun Valley, ID, has adjusted occupancy pacing 39% ahead, increasing from 6.0% to 8.4%, while ADR declined 13%.
A similar pattern appears in Whitefish, MT. KeyData documented that adjusted occupancy in Whitefish, MT, is pacing 39% ahead while ADR is down 21.5%, yet adjusted RevPAR remains 9% ahead of last year. KeyData emphasized that lower market-level ADR does not automatically indicate active discounting, as changes in property mix, reserved stay dates, and remaining inventory affect average rate calculations.
Across all 19 markets studied, KeyData found no destination where adjusted paid occupancy was pacing ahead while adjusted RevPAR was behind. Where occupancy expanded, higher volume fully offset lower ADR.
Snowmass Village, CO, demonstrated the opposite pricing structure. KeyData reported that adjusted occupancy in Snowmass Village, CO, is pacing nearly 7% behind, falling from 20.9% to 19.5%, but an ADR increase of 15% kept adjusted RevPAR 7% ahead of last year.
The Rocky Mountain slowdown
The five markets trailing last year's pacing performance share a distinct geographic footprint in the Rocky Mountains. Reduced adjusted occupancy is the primary factor driving revenue declines in four of these five destinations.

KeyData reported that adjusted occupancy in Steamboat Springs, CO, is pacing 15% behind last year, dropping from 13.9% to 11.8%. In Winter Park, CO, adjusted occupancy declined 10%, moving from 13.0% to 11.7%. Park City, UT, saw adjusted occupancy drop 9%, falling from 9.8% to 8.9%, while Jackson Hole, WY, dropped 9%, declining from 13.3% to 12.1%.
KeyData pointed out that absolute occupancy levels provide necessary context to these percentage drops. Although Steamboat Springs, CO, is pacing 15% behind last year, its current adjusted occupancy of 11.8% remains higher than the 7.8% adjusted occupancy recorded in Taos, NM, despite Taos posting an 87% year-over-year increase.
Slight ADR increases in Steamboat Springs, CO (+2%) and Jackson Hole, WY (+1%) were insufficient to offset lower occupancy. In Winter Park, CO, and Park City, UT, both occupancy and ADR are pacing below last year's levels. Summit and Eagle County Ski Areas, CO, represented the exception, where adjusted occupancy fell just 2% while ADR dropped 7%, making lower rates the primary driver of its 9% adjusted RevPAR decline.
KeyData noted that previous winter conditions may influence current booking behavior. During the 2025–26 ski season, record-low snowpack and warmer temperatures affected resort operations across Colorado and Utah. Colorado Ski Country USA reported that skier visits fell nearly 24% below the prior season, with resorts operating for an average of 129 days compared with a 20-year average of 144 days.
Intra-state divergence in Colorado
Performance metrics vary substantially among ski destinations located within the same state. KeyData's analysis of Colorado markets highlights contrasting strategies and revenue results across neighboring mountain valleys.
While Steamboat Springs, CO (-13.5%), Winter Park, CO (-12.3%), and Summit and Eagle County Ski Areas, CO (-9.1%) are pacing behind in adjusted RevPAR, four other Colorado destinations are pacing ahead of last year: Aspen, CO (+44%), Crested Butte, CO (+38%), Telluride, CO (+8%), and Snowmass Village, CO (+7%).
The drivers of growth within Colorado differ by market:
- Aspen, CO, reliance on occupancy expansion, with adjusted occupancy rising 44% from 5.4% to 7.8% while ADR remained essentially flat.
- Crested Butte, CO, reliance on rate increases, where adjusted occupancy rose 4% while ADR climbed 33%.
- Snowmass Village, CO, reliance on rate increases, where a 15% gain in ADR offset a nearly 7% decline in adjusted occupancy.
KeyData noted that comparison baselines affect these figures. Crested Butte, CO, entered the 2025–26 winter season from a lower performance baseline, meaning its 38% RevPAR gain partly reflects a recovery to baseline demand levels.
Weather and early booking patterns
Weather forecasts remain a critical variable for winter short-term rental performance. According to KeyData, NOAA expects a strong-to-very strong El Niño pattern to persist through the winter months.
The NOAA seasonal outlook indicates higher probabilities of wetter conditions across parts of California and the Southwest, aligning with strong early pacing in Heavenly, CA, Mammoth Lakes, CA, and Taos, NM. For higher-elevation destinations, increased precipitation can bolster snowpack if ambient temperatures remain cold enough.
For northern destinations, NOAA seasonal forecasts suggest increased chances of above-normal temperatures and drier conditions in some areas. Despite this forecast, northern ski markets are entering winter with positive pacing. KeyData reported that Sun Valley, ID, and Whitefish, MT, are both ahead in adjusted RevPAR, alongside Vermont destinations including Killington, VT, Stowe, VT, and Okemo Valley, VT.
KeyData observed that booking window length varies among markets. Several destinations with large occupancy gains currently show shorter average booking windows among active reservations than markets that are pacing behind. KeyData noted that while this indicates early pacing gains are not simply due to reservations being booked further in advance, available data without multi-year booking window comparisons cannot confirm overall changes in traveler lead times.
What to watch
As the winter ski season opens, hosts, property managers, and investors should track specific operational indicators across target markets:
- Monitor booking velocity and rate adjustments as snowfall begins and resort opening dates are confirmed.
- Track absolute occupancy levels rather than year-over-year percentage changes to evaluate true calendar coverage.
- Assess whether property managers in high-occupancy growth markets can increase average daily rates on remaining open inventory.
- Observe whether Rocky Mountain destinations experience late-window booking pickups that narrow current RevPAR gaps.
Figures checked by the standards desk (Paul Ostrowski): every figure in this story was matched to the source material listed below before publication. 1 figure that could not be matched was removed.
Tally from the accuracy gate: 100 details tested; 100 found in the stored source; nothing cut.
Is a figure here wrong? Say so / The corrections procedure and the log

Related stories

U.S. short-term rental revenue paced 26% higher for September 2026, KeyData reported

Short-term rental rates drove $276.7 million World Cup revenue lift in July 2026

How property management fees and listing channels shape short-term rental revenue

UK Short-Term Rental RevPAR Holds Firm as Hotels Fall 8% in Q3 2026
Picture from Wikimedia Commons; licence CC BY-SA 4.0; photographer Dominic Nelson
Read the desk every morning.
Leave your address for the Booked News briefing: the day's figures on rates, occupancy, demand, fees, supply and returns, each with its source, in one short email.
Comment thread