Short-term rental rates drove $276.7 million World Cup revenue lift in July 2026
AirDNA reported that higher nightly rates accounted for 84% of the revenue windfall across the 16 host cities during the 39-day tournament.

On July 22, 2026, AirDNA reported that short-term rentals across the 16 host cities of the FIFA World Cup generated an additional $276.7 million in revenue during the tournament compared to the same period in 2025. This windfall was driven overwhelmingly by pricing power, with higher nightly rates accounting for 84% of the revenue lift, while a surge in new listings pushed occupancy down in most host markets.
The tournament, which spanned 39 days from June 10 to July 19, 2026, delivered uneven results across the broader travel sector, but short-term rentals emerged as a primary beneficiary. Total revenue for short-term rentals in the host cities reached $1.33 billion during the event, representing a 26% increase over the same period in 2025. The United States led the financial gains with a lift of $214.4 million, followed by Canada at $31.6 million and Mexico at $30.6 million.
What the data shows
According to AirDNA, the $276.7 million in additional revenue was heavily concentrated in the United States, which led with a lift of $214.4 million. Canada followed with a revenue increase of $31.6 million, and Mexico recorded a gain of $30.6 million. The revenue growth was driven by higher average daily rates, which accounted for $231.8 million of the total lift, while additional nights booked contributed just $44.9 million, or 16% of the gain.
Four major markets captured the largest absolute shares of this revenue lift. Miami short-term rentals generated an additional $42.7 million, followed by Los Angeles at $32.7 million, Dallas/Fort Worth at $26 million, and the combined market of New York/Jersey City/Newark at $22.8 million. Conversely, the smallest host markets experienced the most dramatic year-over-year percentage growth in total revenue. Monterrey saw revenue rise 96% year over year, Guadalajara grew 91%, and Kansas City increased 88%.
A separate analysis published by KeyData on July 22, 2026, corroborated this pricing-led trend. KeyData reported that adjusted revenue per available rental (RevPAR) rose around 24% year over year across 13 host markets in the United States and Canada during the tournament window of June 11 to July 19, 2026. This RevPAR growth was driven by average daily rates rising around 20% year over year, while adjusted paid occupancy increased more modestly at around 3%.
KeyData reported that Kansas City recorded the strongest adjusted RevPAR growth of any host city at 51% year over year, supported by a 42% rise in average daily rate (ADR) and a 6% increase in adjusted paid occupancy. New York/Newark followed with adjusted RevPAR up 40%, driven by a 17% gain in adjusted paid occupancy and a 19% rise in ADR. San Francisco Bay ranked third with adjusted RevPAR up 33%, driven by a 33% rise in ADR while adjusted paid occupancy held flat.
KeyData also reported that average stay length declined around 3% across host cities. Several markets saw sharper drops, including Miami, which fell 14%, New York/Newark, which fell 13%, and Philadelphia, which fell 11%. The pattern suggests many visitors planned focused trips around individual matches rather than extended vacations. Vancouver followed a different pattern, where nightly rates were essentially flat year over year, but the average length of stay increased by 18%, the largest rise among the host cities.
How it was measured
The figures were compiled by multiple short-term rental analytics platforms using distinct methodologies and timeframes. AirDNA measured performance across 16 host cities in the United States, Canada, and Mexico during the World Cup tournament window of June 10 to July 19, 2026, comparing the data directly to the same period in 2025.
KeyData analyzed 13 host markets in the United States and Canada, comparing the tournament window of June 11 to July 19, 2026, with the same period in 2025. KeyData ranked each market by average daily rate, adjusted paid occupancy, and adjusted RevPAR.
Property management platform Guesty analyzed booking performance across its customer base during the tournament. Guesty compared matchday booking demand, occupancy, and average daily rates against year-over-year baselines, tracking specific metrics such as booking windows, arrival origins, and localized demand shifts around stadiums.
Supply growth dampens occupancy gains
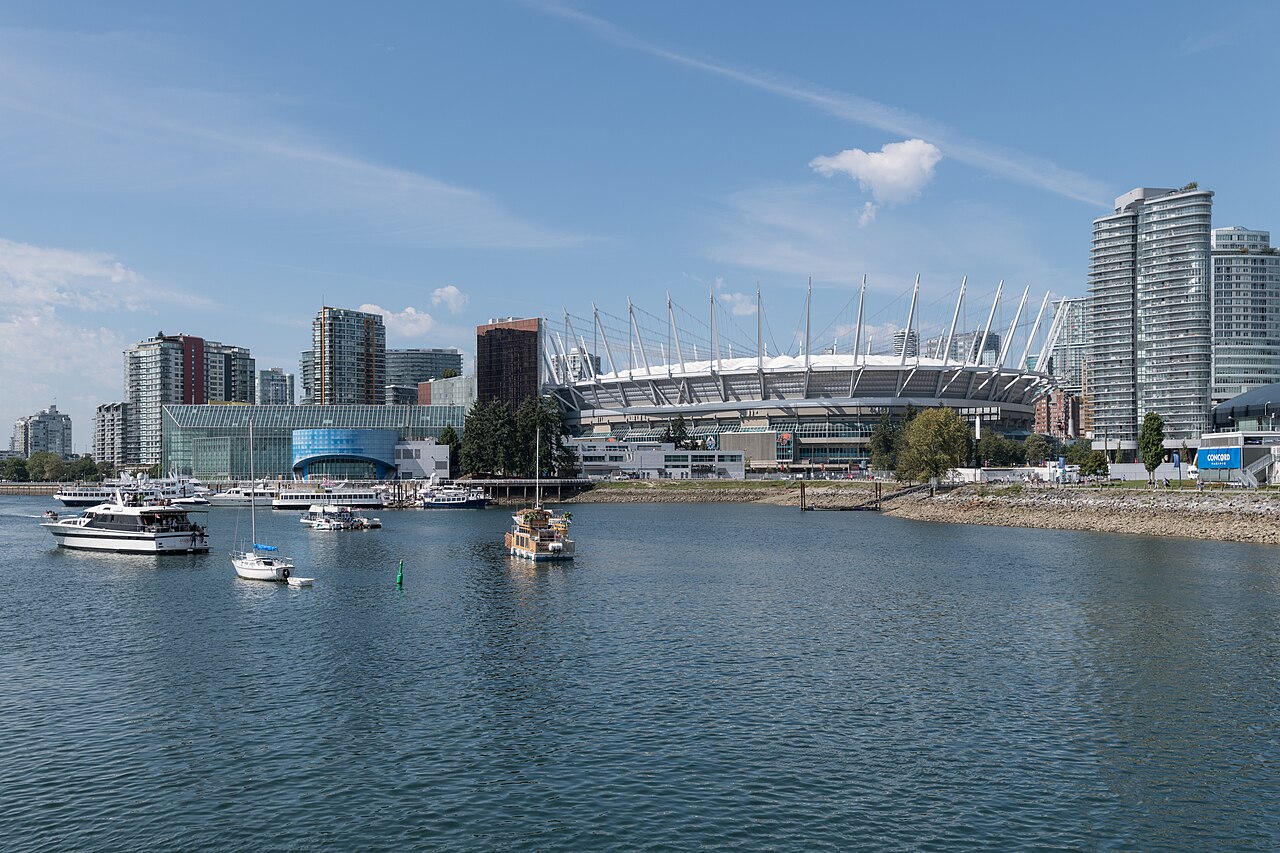
Despite the influx of travelers, the tournament did not translate into widespread occupancy gains due to a significant expansion in property listings. AirDNA reported that 12 of the 16 host markets experienced year-over-year occupancy declines because supply growth outpaced the demand generated by the matches.
This supply-and-demand imbalance was most visible in Kansas City. While demand nights in Kansas City rose 20% year over year, a 48% year-over-year surge in available supply nights pushed overall occupancy down 19% year over year. A similar trend occurred in Seattle and Vancouver, where supply growth combined with muted demand to produce year-over-year occupancy declines of roughly 15% in both markets.
However, KeyData's analysis of professionally managed rentals showed a different dynamic for specific segments. KeyData reported that adjusted paid occupancy rose 6% in Kansas City and 17% in New York/Newark. This variance highlights how professional property managers performed relative to the broader market, which was flooded with new, unmanaged individual listings.
Pricing power in supply-constrained markets
While occupancy fell across the broader market, hosts maintained strong pricing power. AirDNA reported that 14 of the 16 host cities saw booked rates rise more than 20% on game days and eves, and 13 of the 16 cities saw booked rates climb more than 20% on surrounding dates. Guesty reported that its customers took average daily rates up in every host location.
Supply-constrained markets in Mexico and the United States achieved the largest rate increases. Booked rates in Guadalajara, Monterrey, Mexico City, and Kansas City rose more than 60% year over year on game days and eves. On dates surrounding the matches, booked rates in all four of these markets rose more than 40% year over year. In contrast, San Francisco and Los Angeles recorded the weakest rate growth, with rate premiums coming in under 15%.
KeyData also reported substantial revenue gains driven by pricing in other markets. During the tournament, average daily rates rose 36% in Philadelphia, 33% in the San Francisco Bay Area, and 30% in Boston. According to KeyData, these markets generated substantial revenue gains primarily by commanding higher nightly rates rather than filling more nights.
Booking windows and match-level dynamics
The timing of bookings and the specific matchups played a critical role in rental performance. AirDNA reported that star-powered group stage matches often outperformed later knockout rounds because fans could plan their trips further in advance. Group stage matchups were determined well ahead of time, allowing fans to book early, whereas knockout round matchups were not known until days before the games, causing fans to hesitate.
In Dallas/Fort Worth, the group stage match between Austria and Argentina saw a 152% year-over-year increase in bookings made more than 90 days in advance, representing nearly 30% of all bookings for the match. More than 6,000 nights were booked 90 or more days out for this game. By comparison, the semifinal match between France and Spain in Dallas/Fort Worth saw only 3,300 nights booked 90 or more days in advance. Although bookings made within two weeks of the semifinal rose 25% year over year, total demand for the semifinal was up only 14% year over year, compared to 32% for the Austria vs. Argentina group stage match.
Guesty's data confirmed that last-minute bookings defined a significant portion of the tournament. Across the group stage, a quarter of all bookings were made within two weeks of the stay, and 16% were made within a single week. In Houston, 21% of bookings for the round-of-32 match were made within a week of the stay, compared to 16% for the same dates in 2025.
The devotion of specific fan bases also altered booking windows. Guesty reported that flight bookings from Argentina to Atlanta rose 108% ahead of the semifinal, but bookings to New York for the final lagged because fans would not commit until they knew their team had qualified. Once the bracket was decided on July 15, fans booked rapidly.
Localized demand and the final rounds
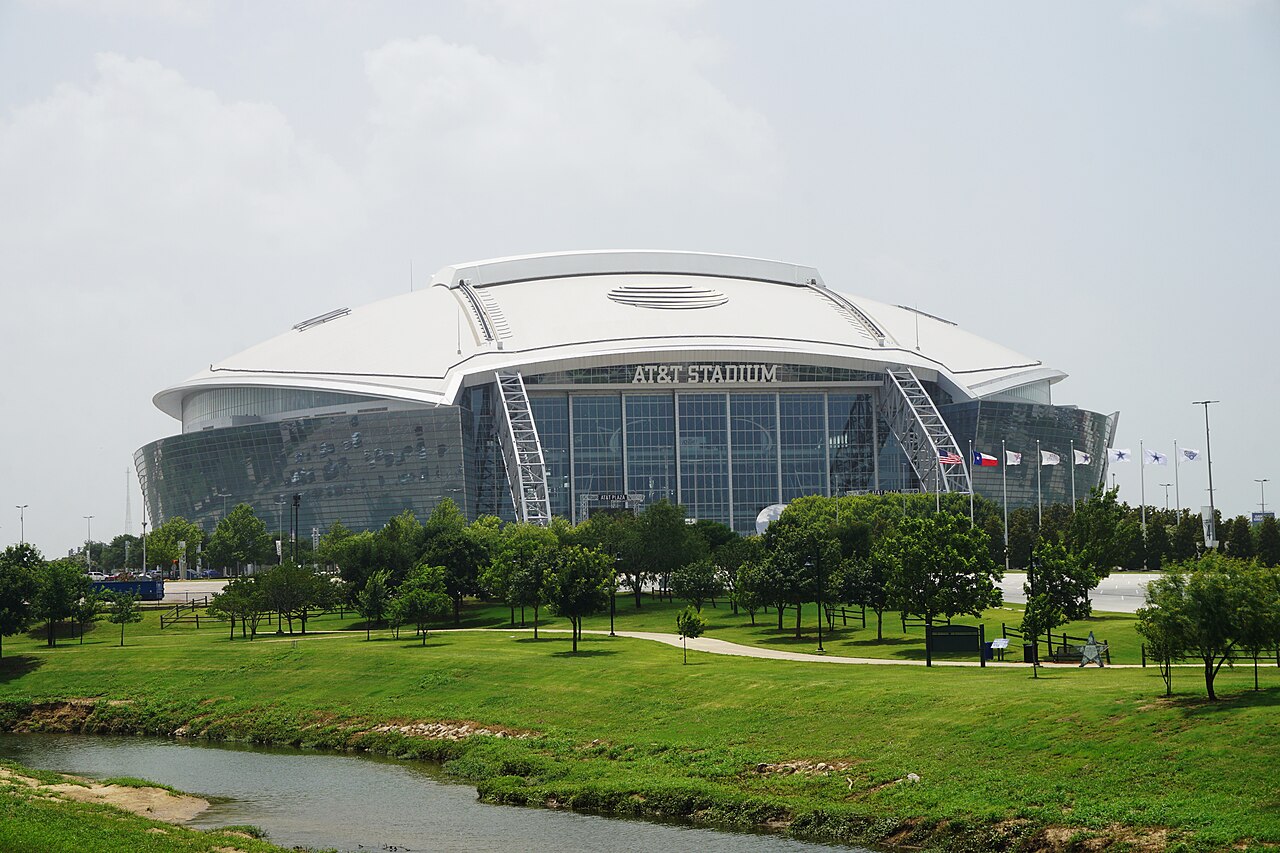
The physical location of the matches created distinct geographic shifts in demand. In the Dallas market, matches were played at a stadium in Arlington, which sits between Dallas and Fort Worth. Consequently, Fort Worth saw matchday short-term rental demand rise 45% year over year, outperforming Dallas itself, which saw a 27% increase. When France played Spain in Arlington on July 14, booked rates rose 41% in Fort Worth compared to 28% in Dallas itself.
A similar geographic split occurred during the World Cup Final, which was held at MetLife Stadium in East Rutherford, New Jersey. In Jersey City and Newark, the municipalities closest to the stadium, demand on game days and eves rose 16% year over year, with demand jumping 39% year over year for the World Cup Final. Booked rates in Jersey City and Newark rose 37% to 46% across World Cup matches. On the night of the final, demand in Jersey City and Newark rose 45% above the previous year, with booked rates up 39%.
In contrast, New York City, which maintained its short-term rental restrictions, saw demand drop 4% to 8% year over year across most World Cup matches. The sole exception was the Final, where demand in New York rose 1% year over year. Rate growth for New York hosts was also more modest, averaging around 15% across game days and eves, with a 20% year-over-year increase recorded specifically for the Final. Guesty reported that its customers in New York outperformed the broader market, with average daily rates rising 19% in June and 25% across July, compared to the market average climb of 15% to 19%.
What to take from it
The performance of short-term rentals during the 2026 World Cup offers several critical lessons for hosts, managers, and investors preparing for future large-scale events.
- Focus on pricing over occupancy: With 84% of the revenue lift driven by higher nightly rates, operators should prioritize raising average daily rates rather than lowering prices to guarantee bookings.
- Monitor local supply growth: A major event can trigger a massive surge in new listings, as seen in Kansas City's 48% supply increase, which can severely depress occupancy even when demand is high.
- Understand match-specific booking windows: Group stage matches with pre-determined teams attract early bookings, while knockout rounds rely heavily on last-minute bookings from fans waiting for results.
- Capitalize on geographic spillovers: Properties located in neighboring municipalities, such as Fort Worth or Jersey City, can experience higher demand growth and pricing power than the primary host cities themselves.
Figures checked by the standards desk (Paul Ostrowski): every figure in this story was matched to the source material listed below before publication. The desk's review found nothing to correct.
Sources
- AirDNA - published July 22, 2026.
- 10 Minutes News for Hoteliers (KeyData release) - corroborating coverage.
- Guesty - corroborating coverage.
Part of the Booked News record for July 2026. The desk filed this story on October 9, 2026 from a source published in the month it covers, under the same figure rule as the daily news.
Report an error in this story · Corrections policy and log

Related stories

U.S. short-term rental bookings rose 5.5% in January 2026 as supply outpaced demand

Why seasonal occupancy swings shape short-term rental returns in Naples

U.S. short-term rental RevPAR fell 0.6% in August 2026

Read the desk every morning.
Leave your address for the Booked News briefing: the day's figures on rates, occupancy, demand, fees, supply and returns, each with its source, in one short email.
Comments