Kansas City short-term rental bookings rose 49% as the World Cup began in June 2026
AirDNA reported highly uneven demand spikes across World Cup host cities, with New York matchday bookings falling nearly 5 percent.

On June 19, 2026, Newsweek reported that short-term rental booking demand in Kansas City rose by an average of 49 percent compared to the same period in the previous year, highlighting the highly uneven impact of the 2026 FIFA World Cup across different host cities. While some markets experienced significant spikes in matchday bookings, other major destinations saw flat or declining interest as the tournament got underway.
According to data from the short-term rental analytics platform AirDNA, cities hosting World Cup matches saw highly divergent performance. While Kansas City and several Texas markets recorded substantial increases in booking volume, New York experienced a drop in matchday demand of nearly 5 percent year-over-year. The figures revealed that even a global sporting event of this scale did not guarantee a uniform windfall for short-term rental hosts or traditional lodging providers.
What the data shows
In Kansas City, which was scheduled to host four group-stage games and two knockout matches, booking demand rose by an average of 49 percent compared to the same period in the prior year. The demand was highly concentrated around specific match dates. For instance, the June 16 match between Argentina and Algeria generated an 83-percent lift in demand on that specific day. According to AirDNA data published on June 3, 2026, the booking rate for that opening match in Kansas City stood at 59%, representing an incremental climb from 56% recorded one week earlier.
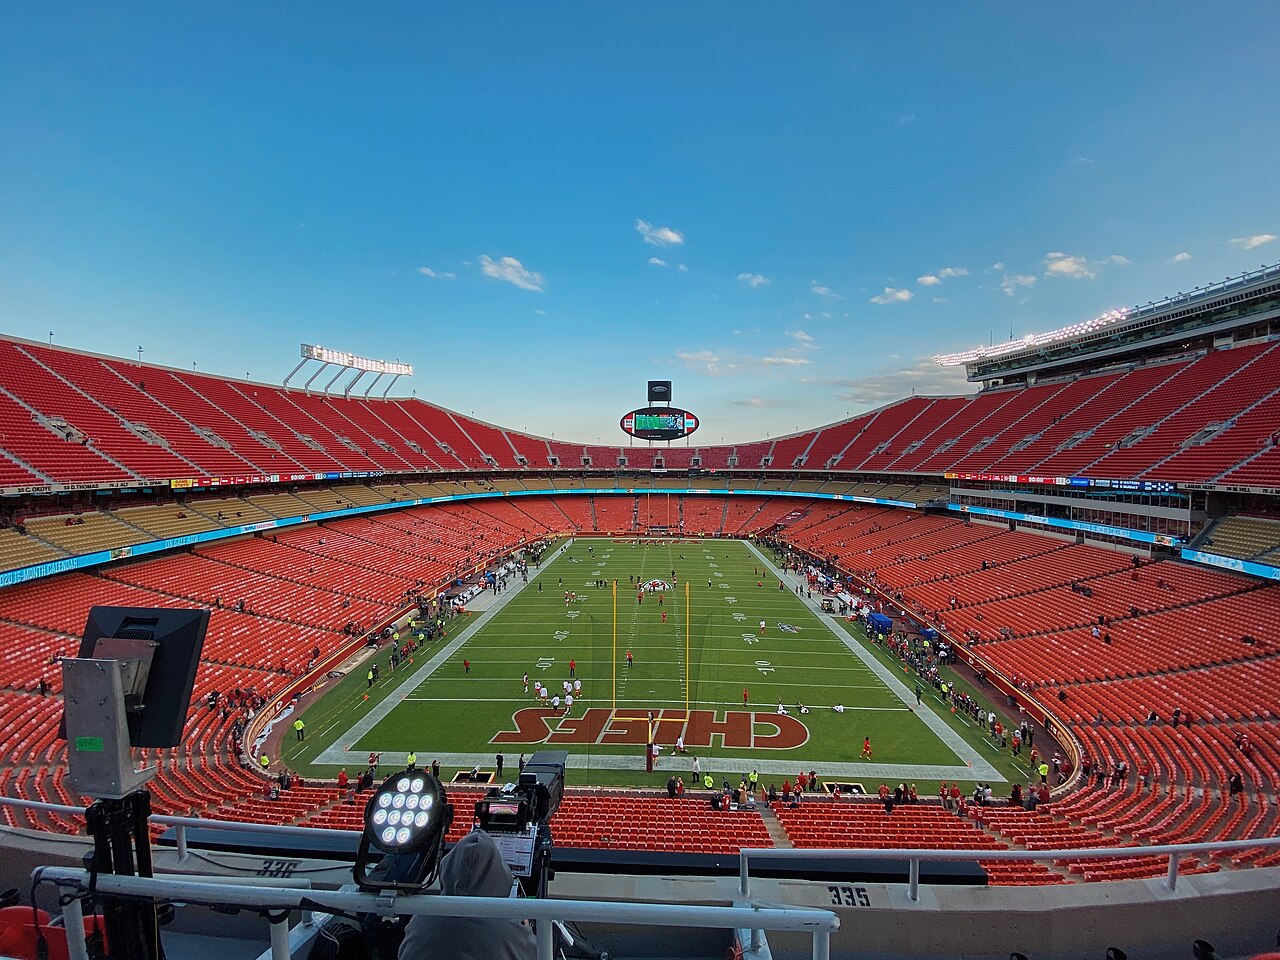
Other host cities in the southern United States also experienced substantial demand increases. In Texas, Dallas saw short-term rental booking demand rise by an average of 27 percent year-over-year on matchdays, while neighboring Fort Worth recorded an average surge of 45 percent. Miami experienced a 40 percent jump in demand year-over-year. AirDNA noted that this growth reflected a broader pattern where already popular tourism destinations saw their existing demand amplified by the tournament, while markets with higher baseline supply or lower typical demand experienced different peak dynamics.
In contrast, New York, which served as a primary hub for matches played at the New York New Jersey Stadium, saw short-term rental demand on matchdays drop by nearly 5 percent year-over-year. This downward trend was also reflected in the traditional hotel sector. In May 2026, Vijay Dandapani, the president and CEO of the Hotel Association of New York City, stated that hotel booking rates were tracking below expectations. Dandapani noted that hoteliers in the city expected to miss out on more than $100 million in anticipated room revenue as a direct result of these lower-than-expected booking rates.
Despite these mixed local outcomes, Airbnb reported strong aggregate interest in the tournament. In a statement to Newsweek, the company stated that the 2026 FIFA World Cup would be the biggest hosting event in Airbnb's history. The platform released a forecast indicating that hundreds of thousands more guests were set to book through its website compared to its previous largest event, the 2024 Paris Olympics. Airbnb also reported that for the week ending June 7, 2026, the platform recorded its largest weekly surge in searches for tournament-time stays of the year. The company attributed this pattern to the last-minute booking habits of soccer fans, who frequently wait to book travel until their preferred teams advance to subsequent rounds of the tournament.
How it was measured
The figures in the reports were compiled using different methodologies by AirDNA and Airbnb. AirDNA tracked short-term rental booking activity across World Cup host and feeder cities by monitoring active listings and reservations on platforms such as Airbnb and Vrbo. To determine demand shifts, the analytics firm calculated the average year-over-year percentage change in short-term rental bookings specifically on matchdays compared to the same calendar dates in the previous year. AirDNA also monitored supply-side metrics, tracking the total number of active listings and calculating inventory growth rates over an 11-month period leading up to the tournament.
Airbnb's figures were derived from internal platform data, including search query volumes and booking reservations. The company measured search activity by tracking weekly changes in user queries for stays during the tournament dates, identifying the week ending June 7, 2026, as the peak search period. Airbnb's projections comparing the World Cup to the 2024 Paris Olympics were based on reservation forecasts held at the time of the statement. The reports did not disclose the exact raw search volumes, the specific algorithms used to filter duplicate searches, or the precise geographic boundaries used to define the host city markets.
Supply-side shifts and inventory growth
The performance of individual markets was heavily influenced by rapid supply-side expansion. In Kansas City, short-term rental inventory grew by 43% over an 11-month period preceding the tournament. According to Bram Gallagher, AirDNA's director of economics and forecasting, this represented the highest inventory increase of any World Cup host city by a wide margin. By comparison, Dallas, which had the second-highest rate of inventory expansion, recorded a much smaller 13% jump in listings over the same period.
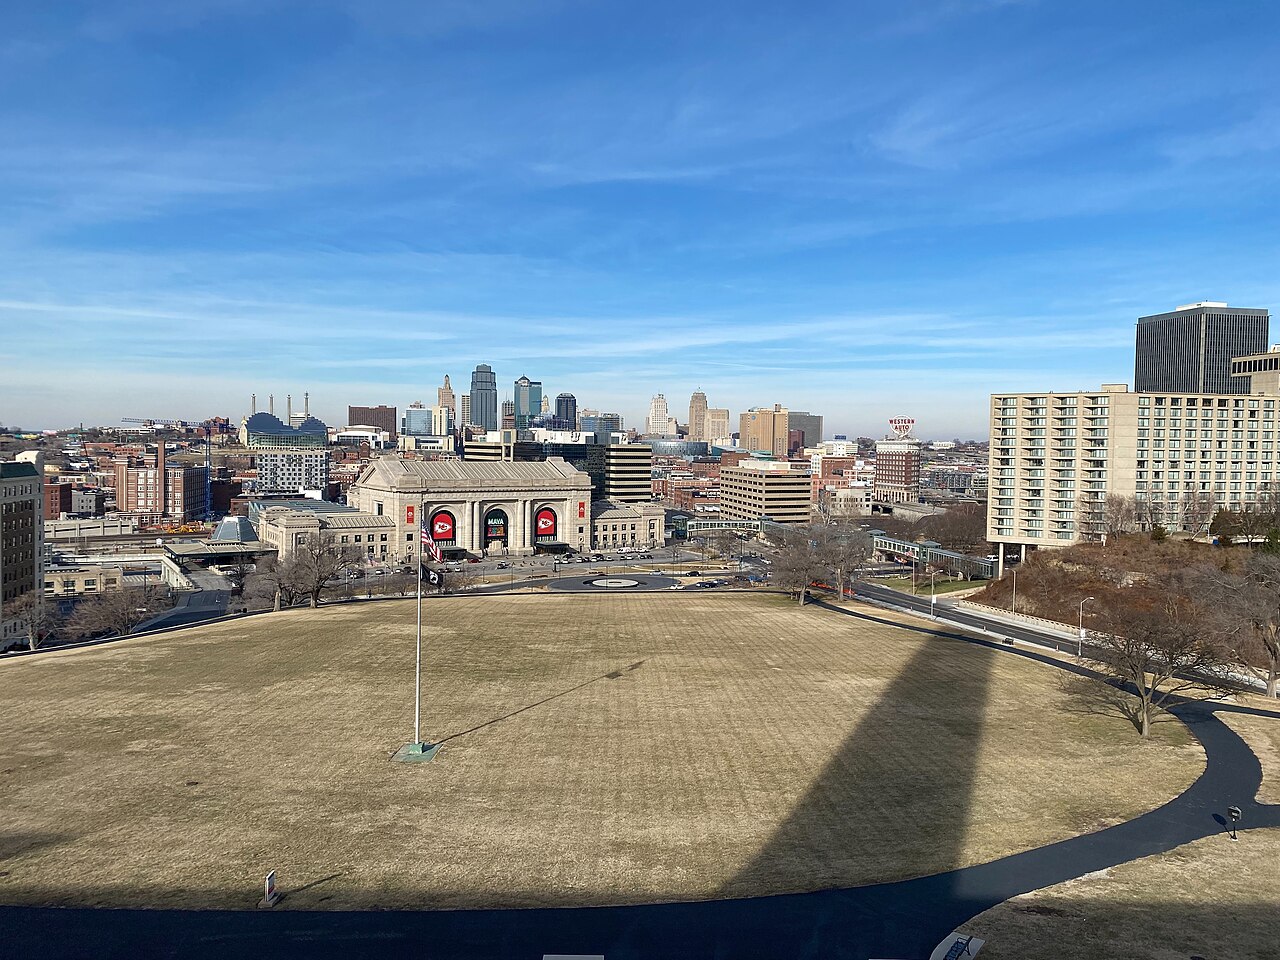
This rapid expansion brought the total number of active listings in the Kansas City metro area to more than 5,500. Many of these properties were listed by first-time hosts who entered the market specifically to capitalize on the expected influx of World Cup visitors. Despite this massive influx of new supply, occupancy rates remained resilient. Gallagher noted that the booking rate of 59% for the June 16 match was encouraging when viewed in the context of the expanded inventory. He stated that the ability of the market to maintain higher occupancy rates despite a 43% increase in listings indicated a strong volume of underlying demand and consumer attention directed toward Kansas City.
The reality for property managers
Professional property managers in host cities adopted a more cautious approach than the first-time hosts who flooded the market. Lance Pierce, the owner of Karat Vacation Rental Management, which owned about 40 short-term rentals and managed approximately 40 additional properties in the Kansas City area, warned hosts against falling into a hype cycle. Pierce noted that major local events—including the NFL Draft, and concerts by artists such as Beyoncé and Taylor Swift—frequently generate intense local excitement but typically result in a more modest 10% to 15% bump in actual revenue.
Pierce reported that some of his clients who owned long-term rental properties had considered ending year-long leases and spending between $15,000 and $20,000 to furnish the units as short-term rentals specifically for the World Cup. Pierce advised against these high-cost capital improvements, noting that June and July represent the top-grossing months of the year for Midwestern hosts and are critical to annual profitability. He cautioned that overpricing during these peak months could lead to empty calendar nights and damage overall annual performance.
After initially raising prices significantly, Pierce's firm lowered rates when early ticket sales did not immediately translate into bookings. Consequently, Pierce and his clients projected annual earnings that were 25% to 35% above the previous year's levels. While this represented a meaningful financial gain, it fell short of the blockbuster windfall that many speculative hosts had anticipated when the host cities were first announced. For first-time hosts who had temporarily vacated their primary residences, Pierce recommended a simple pricing strategy: set the nightly rate at the exact financial value of the inconvenience of moving out, and accept that the property may or may not book at that price.
Pricing and market dynamics
The actual rates achieved in the market reflected these supply and demand dynamics. According to AirDNA, the average booked nightly rate in Kansas City was around $250 on the night of the June 16 match between Argentina and Algeria. However, weekend matches commanded higher premiums, with average booked nightly rates rising closer to $330 a night. These rates were established even as tourism officials, such as Visit KC, maintained their long-term projection of attracting 650,000 visitors to the region during the tournament.
On a broader scale, ticket pricing and tournament logistics played a significant role in shaping overall demand. Stephen Shapiro, the chair of South Carolina's Department of Sport and Entertainment Management, noted that demand for the World Cup had been highly mixed. While premier matches drew significant crowds, Shapiro stated that there was clear evidence that overall tournament demand had been overestimated. He pointed to high ticket prices, which remained hard for many fans to afford, as a primary driver of spotty attendance and empty seats at certain group-stage matches. Shapiro also suggested that the expanded 48-nation format may have diluted fan density across the various host venues, warning that outpricing core fan segments could limit long-term interest in the sport.
“FIFA and future host countries must consider the impact of outpricing certain segments of the fan base, as this can impact long term interest in the sport and limit the growth of young fans who might have the opportunity to watch this great event in person for the first time.”
The mixed demand patterns highlighted several key factors that influenced booking behaviors during the tournament:
- High ticket prices that remained difficult for average fans to afford.
- The rapid 43% expansion of short-term rental inventory in key host cities.
- The expanded 48-nation tournament format which distributed matches across more venues.
- A growing trend of last-minute bookings as fans waited to see which teams advanced.
What to take from it
The data from the 2026 World Cup provides several critical lessons for short-term rental hosts, property managers, and real estate investors when evaluating the financial impact of major international events.
- Track local supply growth metrics alongside demand forecasts, as rapid inventory expansion can quickly dilute booking probabilities and erode pricing power.
- Avoid making permanent, high-cost capital investments or long-term lease alterations based on short-term event demand.
- Implement a flexible pricing strategy that starts with realistic rates and adjusts quickly based on real-time booking velocity rather than holding out for speculative peak pricing.
- Analyze historical baseline performance for peak summer months to ensure that event-specific pricing adjustments do not jeopardize core seasonal revenues.
Figures checked by the standards desk (Paul Ostrowski): every figure in this story was matched to the source material listed below before publication. The desk's review found nothing to correct.
Sources
Part of the Booked News record for June 2026. The desk filed this story on October 9, 2026 from a source published in the month it covers, under the same figure rule as the daily news.
Report an error in this story · Corrections policy and log

Related stories

Crete short-term rental listings fell 5.7% in June 2026 as housing prices rose

European short-term rental rates rose 8.2% in July 2026 as occupancy steadied

U.S. short-term rental RevPAR rose 4.5% in June 2026

U.S. short-term rental occupancy rose to 57.2% in May 2026
Read the desk every morning.
Leave your address for the Booked News briefing: the day's figures on rates, occupancy, demand, fees, supply and returns, each with its source, in one short email.
Comments