New York short-term rental revenue rose 361% during Harry Styles shows in March 2026
KeyData reported that major music tours drove massive revenue and rate gains across stadium, arena, and festival markets, reshaping traditional booking behaviors.

On March 25, 2026, KeyData reported that short-term rental revenue per property in New York City rose 361% year-over-year during arena performances by Harry Styles. The data highlighted a broader trend across major concert markets, where event-driven travel created compressed demand shocks that altered traditional booking patterns, occupancy rates, and average daily rates. According to the lodging intelligence platform, these concert-driven spikes differed fundamentally from typical holiday demand. While property managers often treated concert weekends as standard seasonal holidays by raising rates slightly and waiting for occupancy to rise, the figures indicated that concert tourism represents a highly concentrated, date-fixed, and emotionally driven market that is far less sensitive to price increases.
What the data shows
The performance metrics published by KeyData across four distinct markets demonstrated how major concert tours reshaped local short-term rental economies. In New York City, during the arena performances by Harry Styles, the average daily rate was pacing 32% ahead of the previous year, which helped drive the 361% year-over-year increase in revenue per property. This revenue jump highlighted the high price elasticity of concert-goers in major metropolitan areas where premium lodging is in high demand.

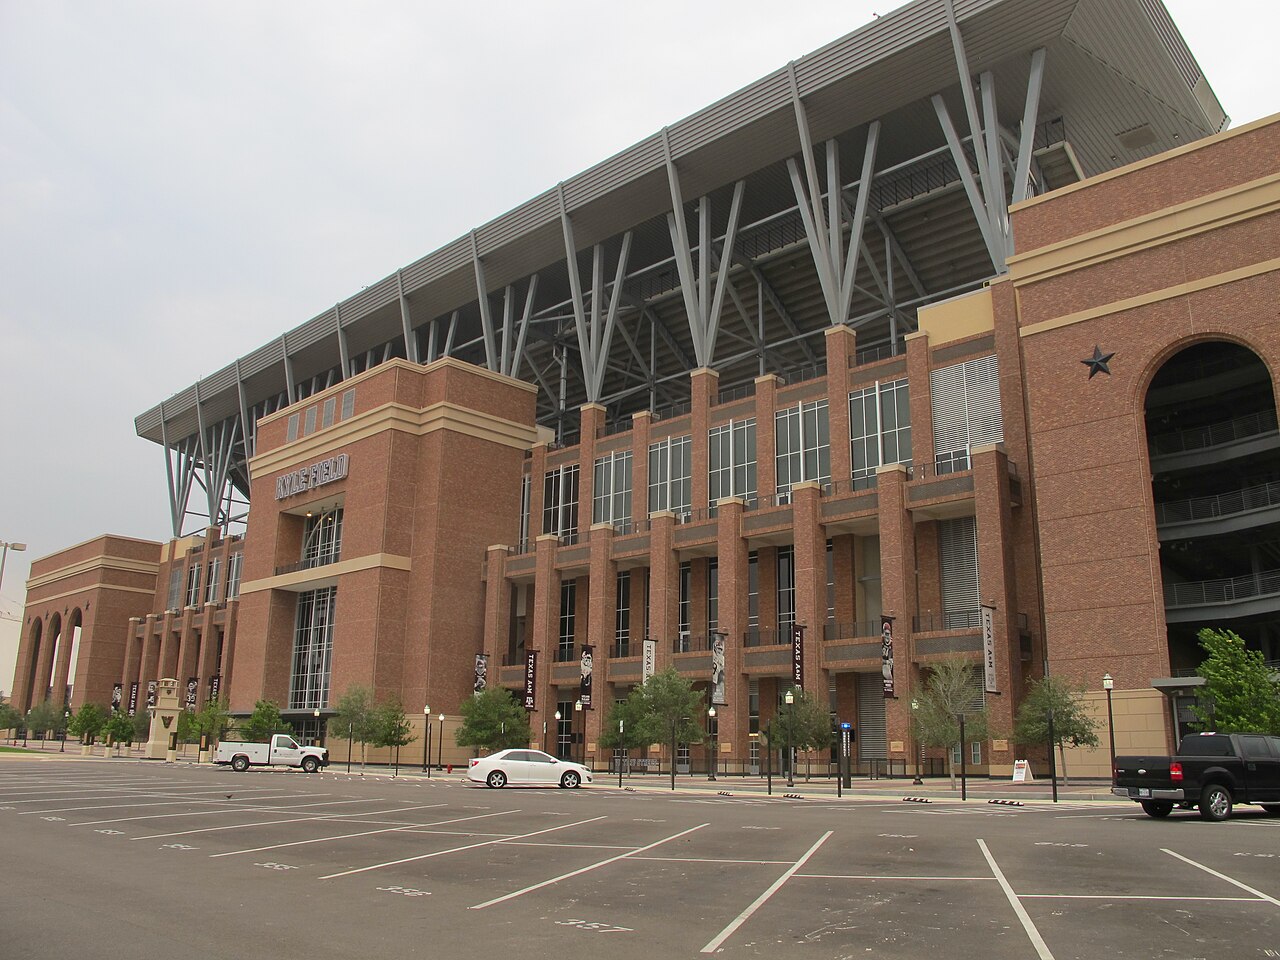
In College Station, Texas, during a single-night stadium performance by George Strait, which was the highest attended concert at that time, the average daily rate increased 128% year-over-year. This rate growth was accompanied by a 239% rise in revenue per property and a 208% surge in reservations per property. However, the average length of stay in College Station declined nearly 40% year-over-year, indicating a highly concentrated single-night demand window. Despite shorter stays, guest nights in the market rose 49% during the event weekend, demonstrating that properties accommodated a much higher volume of distinct travelers.
In Indio, California, during Coachella Weekend 1, revenue per property increased 291% week-over-week. The revenue figure rose from $449 during the prior weekend to $1,758 during the festival weekend. Short-term rental occupancy in Indio jumped from 28% to 59%, representing an increase of 111% week-over-week. The average length of stay in Indio held near 2.85 nights during the festival, indicating a multi-night visitation pattern supported by the weekend-long structure of the event.
In London, England, during a multi-night stadium run by Taylor Swift, the average daily rate increased 8.6% year-over-year. This moderate rate increase supported a 24% climb in revenue per property. Visitors in London exhibited different booking behaviors, with average stays approaching four nights, reflecting the international nature of the travel audience for stadium events in major European transit hubs.
According to KeyData's companion analysis for destination marketers, these event-driven demand patterns reshaped visitor behavior beyond lodging metrics. In College Station, the 40% drop in length of stay created a highly concentrated arrival and departure pattern, stacking check-in volumes and increasing traffic on roads, parking, and visitor services. Conversely, in Indio, the 2.85-night average stay during Coachella supported multi-night visitation patterns, allowing local businesses to capture sustained spending over several days. In London, the average stay approaching four nights reflected international travel behavior, where visitors flying in for stadium shows built longer itineraries around the event.
How it was measured
The figures were compiled and reported by KeyData Dashboard, Inc., a lodging intelligence platform that provides performance analytics, benchmarking, and forecasting for the short-term rental industry. The data was published on March 25, 2026, drawing from real-time reservation data across professional property management portfolios and destination marketing databases.
KeyData did not publish the exact number of properties, listings, or specific property managers included in the datasets for each of the four analyzed markets. The platform analyzed performance metrics including average daily rate, revenue per property, reservations per property, occupancy rates, and average length of stay by comparing the event dates against historical year-over-year baselines or, in the case of Indio, week-over-week performance. The platform's tools, such as ProData and DestinationData, were utilized to track real-time insights for tourism organizations, lodging operators, and real estate investment firms.
What moves these numbers
The primary driver behind these performance shifts was the compressed demand shock unique to major live music events. Unlike seasonal holiday demand, which is broad and predictable, concert-driven demand is fixed to specific dates, highly emotional, and strictly constrained by the capacity of the local venue. This makes concert travelers significantly less price-sensitive than traditional leisure travelers.
The pacing and velocity of reservations also moved these figures. KeyData noted that bookings do not accumulate in a steady, linear fashion. Instead, they arrive in distinct waves. Secondary stadium markets, such as College Station, typically experienced late compression, meaning a high concentration of bookings occurred within a very tight window close to the event date. In contrast, international stadium markets like London experienced a combination of early and late booking waves as long-haul travelers planned extended itineraries. Urban arena markets, such as New York City, absorbed the demand more gradually due to their larger overall lodging supply, yet they still exhibited sharp rate acceleration closer to the performance dates.
Minimum stay policies also directly influenced local performance. In markets with short-haul, drive-to patterns like College Station, rigid multi-night minimum stay requirements risked suppressing booking velocity. Because the average length of stay there fell by nearly 40%, properties that insisted on multi-night stays risked leaving gaps in their calendars. Conversely, in destination festival markets like Indio, where the average stay remained at 2.85 nights, and international markets like London, where stays neared four nights, multi-night minimums aligned well with traveler behavior.
Who these shifts affect
These performance shifts directly affected professional property managers, individual short-term rental hosts, and hospitality investors. Property managers who adjusted their pricing strategies well in advance of ticket sales captured outsized revenue returns, whereas those who waited for visible occupancy compression before raising rates missed the peak pricing window.
The operational teams of property management companies were also heavily affected by these shifts. In College Station, the 208% surge in reservations per property, combined with a 49% increase in guest nights, meant that turnovers were highly concentrated. Shorter stays and more frequent cleanings increased turnover density, requiring managers to coordinate cleaning staff, maintenance, and guest communications within a highly compressed timeframe. However, because concert guests are highly date-committed once tickets are secured, property managers experienced lower cancellation risks, allowing them to plan staffing with greater certainty.
Destination marketing organizations and local municipalities were also affected by the concentrated demand. The influx of visitors during tight windows created immediate operational pressure on local infrastructure, including roads, parking, transit systems, and public services. DMOs had to shift from post-event reporting to active, forward-looking management, using real-time pacing data to coordinate traffic guidance, visitor services, and local business staffing forecasts.
Destination marketing organizations were forced to adjust their marketing timelines to match these booking waves. Rather than relying on post-event reporting, successful DMOs built structured event timelines starting 60 days out to align with lodging partners on volume expectations. At 30 days out, they monitored booking acceleration to adjust marketing messages, supporting shoulder days and geographic dispersal. By 14 days out, they initiated partner forecasts to help local businesses staff appropriately, mitigating the operational strain of concentrated arrivals.
What the figures do not tell you
While the KeyData report highlighted substantial increases in top-line revenue and average daily rates, it did not provide information on the net profitability of these properties. The operational costs associated with increased turnover density, such as emergency cleaning fees, overtime staff wages, and rapid maintenance responses, were not quantified. Consequently, a 239% increase in revenue per property in a drive-to market may have been partially offset by higher operational expenses compared to a standard multi-night holiday booking.
The figures also did not disclose the platform-specific distribution of these bookings. The data did not break down whether the reservations were secured through Airbnb, Vrbo, Booking.com, or direct booking channels, which carry different fee structures that impact a host's take-home revenue. Additionally, the report did not account for regulatory constraints, such as local short-term rental caps, noise ordinances, or temporary event taxes, which can limit a manager's ability to capitalize fully on these demand shocks in certain jurisdictions.
What to take from it
The dynamics of concert-driven demand require property managers to abandon passive holiday pricing strategies in favor of active, event-specific calendars. To prepare for future tour-driven demand shocks, short-term rental operators should implement the following practices:
- Establish an active event monitoring calendar to identify stadium and arena tour dates at least 60 days before tickets go on sale, adjusting base rates upward before the initial booking wave begins.
- Align minimum stay restrictions with historical traveler origin data, utilizing shorter minimums for drive-to stadium markets and longer minimums for international or multi-day festival destinations.
- Monitor booking velocity and reservation pacing on a daily basis inside the 30-day window to adjust rates in rhythm with real-time demand shifts rather than relying on weekly updates.
- Coordinate cleaning and maintenance staffing schedules well in advance to handle the increased turnover density associated with compressed, single-night stays.
Figures checked by the standards desk (Paul Ostrowski): every figure in this story was matched to the source material listed below before publication. The desk's review found nothing to correct.
Sources
- KeyData (Key Data Dashboard) blog - published March 25, 2026.
- KeyData blog (companion version for destination marketers, same date) - corroborating coverage.
Part of the Booked News record for March 2026. The desk filed this story on October 9, 2026 from a source published in the month it covers, under the same figure rule as the daily news.
Report an error in this story · Corrections policy and log

Related stories

KeyData Survey Shows 76.8% of Property Managers Expect Revenue Growth in 2027

U.S. short-term rental revenue paced 26% higher for September 2026, KeyData reported

Short-term rental rates drove $276.7 million World Cup revenue lift in July 2026

Kansas City short-term rental bookings rose 49% as the World Cup began in June 2026
Read the desk every morning.
Leave your address for the Booked News briefing: the day's figures on rates, occupancy, demand, fees, supply and returns, each with its source, in one short email.
Comments