U.S. rental occupancy fell 7 points in the World Cup group stage as rates rose 59%
PriceLabs data showed that while nightly rates rose 59% in the United States, travel barriers and high costs left many host city rentals with fewer bookings.

During the group stage of the 2026 FIFA World Cup, short-term rental occupancy fell seven points in the United States compared to the previous year, even as nightly rates rose 59%, according to PriceLabs data. The data revealed that while the international sporting event drove significant revenue gains through higher pricing, it failed to generate the anticipated surge in bookings across the majority of host cities in North America.
In the matches played during the initial phase of the tournament, short-term rental operators near the stadiums charged far more per night than they did a year prior while filling the same share of rooms or fewer. Rental Scale-Up had reported six weeks before kickoff that demand would likely disappoint due to travel difficulties rather than an oversupply of listings. The final figures from the group stage confirmed this expectation, showing that supply barely moved, rising 1% in the United States and 2% in Canada, meaning that the soft occupancy was not driven by an oversupply of properties.
What the data shows
According to PriceLabs data, the 2026 FIFA World Cup raised rates far more than occupancy across all three host countries. Despite the drop in occupancy in multiple markets, revenue per listing still rose everywhere due to the steep pricing premiums. In Mexico, occupancy across the host markets was flat against the prior year, rising a single point, while nightly rates rose 158% and revenue per listing rose 164%. In the United States, occupancy fell seven points, rates rose 59%, and revenue per listing rose 39%. In Canada, occupancy fell about seventeen points, which represented the steepest decline among the three host nations, while rates rose 58% and revenue per listing rose 23%.
The data showed that all sixteen stadium markets earned more per rental than a year prior, but at about thirteen of those markets, occupancy was flat or down. The financial gains were driven almost entirely by pricing rather than volume. Even matches featuring the teams with the largest and most loyal fan bases, such as Brazil, England, Germany, and Argentina, did not generate extra bookings compared to the previous year. While these high-profile matches drew the highest occupancies of the entire tournament, with occupancies ranging from 60% to 70%, those same dates were as full or fuller a year earlier. The star power of these teams packed rooms against the rest of the 2026 schedule, but not when compared to the 2025 baseline.
How it was measured
The figures were compiled by PriceLabs. The data tracked short-term rental performance metrics, including occupancy rates, nightly rates, and revenue per listing, across the sixteen host cities in the United States, Canada, and Mexico during the group stage of the 2026 FIFA World Cup. These metrics were compared directly against the performance of the same markets during the same dates in the summer of 2025. The platform monitored listing supply changes, noting a 1% increase in the United States and a 2% increase in Canada. The source did not publish further details on its specific property-matching methodology or the total number of listings tracked.
The Guadalajara exception
Guadalajara stood out as the only host city that succeeded in growing its occupancy year over year. The performance of this single market carried the entire national gain for Mexico, hiding a split where the other two Mexican host cities remained flat or declined. On June 18, 2026, when Mexico played South Korea in Guadalajara, occupancy in the city reached 71% compared to 45% on the same date a year earlier. This surge in demand occurred even though the city had more listings than the year before, and it drove a 368% increase in revenue per listing.
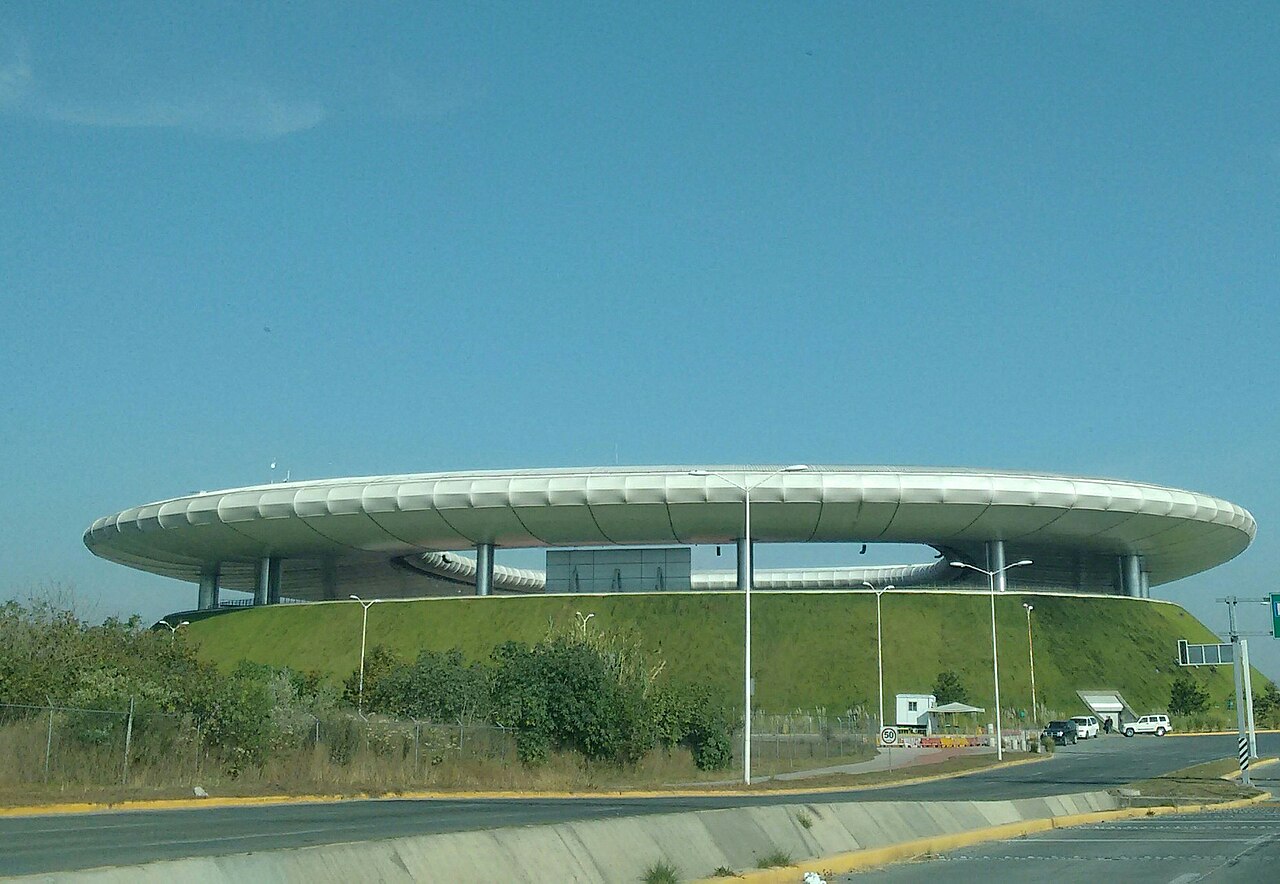
PriceLabs identified two primary factors that set Guadalajara apart from the other fifteen host markets. First, domestic and international fans faced fewer barriers to entry. Mexican supporters traveled within their own country to watch the national team without needing a visa, while foreign supporters, such as those from South Korea, found Mexico far easier to enter than the United States. Second, Guadalajara had significant room to grow. June is not the high season for tourism in Guadalajara, meaning the city entered the tournament with a baseline occupancy of around 45%. This was well below the 70% to 80% occupancy rates that strong United States and Canadian summer markets were already running, leaving ample empty nights for the World Cup matches to fill.
Travel barriers and visa restrictions
The anticipated influx of international visitors failed to materialize due to a series of significant travel barriers. A United States travel ban directly covered fans from four qualified countries: Côte d’Ivoire, Haiti, Iran, and Senegal, effectively shutting out entire national fan bases from attending matches in American host cities. Furthermore, visa issues blocked other ticket holders; for example, at least forty-plus Moroccan supporters were denied visas despite already holding match tickets and hotel room bookings.
In addition to formal visa denials, domestic security measures discouraged attendance in immigrant-heavy host cities. The Department of Homeland Security confirmed that immigration agents would be present at stadiums, which gave local fans in those communities a reason to stay away from the venues.
Where these barriers hit, the short-term rental performance data followed. At SoFi Stadium in Los Angeles, the two matches involving Iran were the weakest dates for the venue, with occupancy down seven to ten points compared to the previous year. This decline occurred even though SoFi Stadium had fewer active listings than before, confirming that an oversupply of rentals was not the cause of the drop.
Rising costs and softening demand
For fans who were legally permitted to enter the host countries, the rising cost of travel diminished the appeal of attending the matches. For example, the cost of a round-trip train ticket to MetLife Stadium in New Jersey rose to $98, compared to a normal fare near $13.
The ticket market flagged soft demand early in the process. Before the tournament kicked off, FIFA cut ticket prices across all 104 matches and handed back most of its block-booked hotel rooms. These high prices for lodging and transport sat on top of the nights that regular summer guests would have booked under normal circumstances. Because of the steep pricing premiums, ordinary summer travelers chose not to book, and the international visitors expected by hosts did not arrive to replace them.
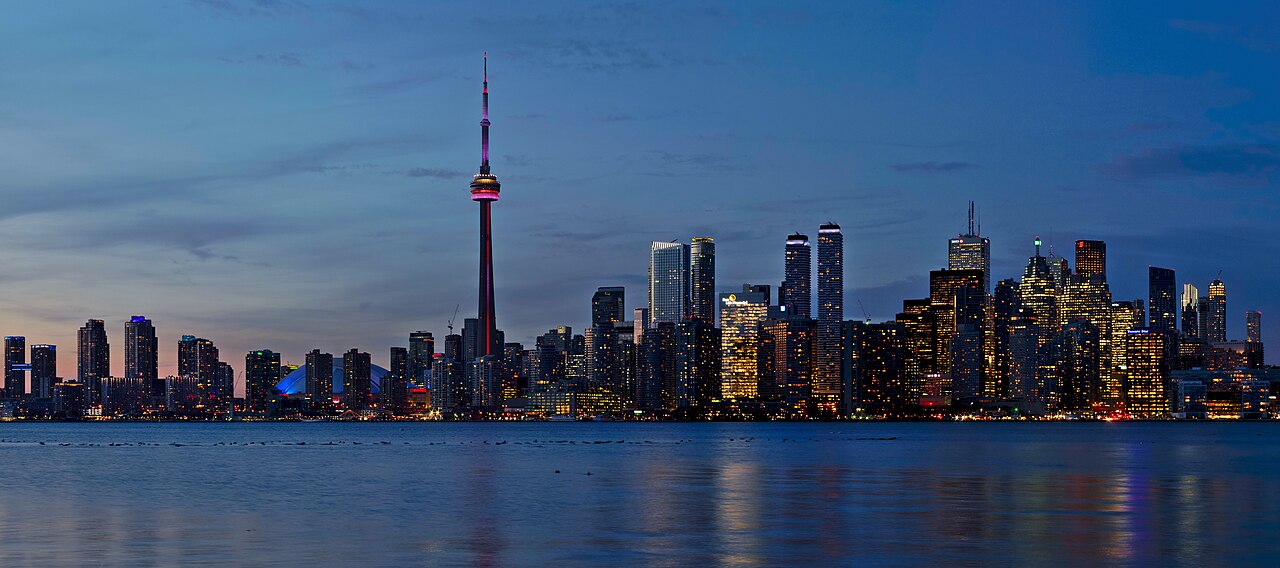
This dynamic was particularly clear in Vancouver. The Canadian city ran near 75% occupancy last June on ordinary summer demand, but occupancy fell to 50% this year during the tournament, representing the largest drop of any venue. This decline occurred despite nightly rates rising 83% and short-term rental supply being capped under the city's strict short-term rental rules.
What to take from it
For short-term rental hosts, property managers, and investors, the performance of the 2026 FIFA World Cup group stage offers several key lessons for managing properties during major international events:
- Compare local regulatory and travel conditions against global demand projections before raising rates, as visa policies and travel bans can instantly eliminate entire target fan bases.
- Evaluate the baseline occupancy of your specific market during the event month; markets with low baseline occupancy have more room to benefit from event crowds than markets that already run near capacity during peak summer months.
- Monitor local supply changes and transport costs, as secondary expenses like train fares and parking can deter domestic travelers even if ticket prices are reduced.
- Avoid relying solely on national averages, which can be heavily skewed by a single high-performing market, as seen with Guadalajara carrying the national performance of Mexico.
Figures checked by the standards desk (Paul Ostrowski): every figure in this story was matched to the source material listed below before publication. The desk's review raised 4 points, corrected before publication.
Sources
- Rental Scale-Up (PriceLabs data) - published June 18, 2026.
Part of the Booked News record for June 2026. The desk filed this story on October 9, 2026 from a source published in the month it covers, under the same figure rule as the daily news.
Report an error in this story · Corrections policy and log

Related stories

U.S. short-term rental RevPAR fell 0.6% in August 2026

U.S. short-term rental revenue paced 26% higher for September 2026, KeyData reported

U.S. short-term rental RevPAR rose 4.5% in June 2026

U.S. short-term rental occupancy rose to 57.2% in May 2026
Read the desk every morning.
Leave your address for the Booked News briefing: the day's figures on rates, occupancy, demand, fees, supply and returns, each with its source, in one short email.
Comments