Grand Strand vacation rentals reached 87.5% occupancy on July 4, 2026
KeyData reported a 6% increase in vacation rental occupancy on the Grand Strand for Saturday, July 4, 2026, while hotel occupancy reached 93.2%.

On July 10, 2026, tourism reports revealed that vacation rental occupancy on the Grand Strand reached 87.5% on Saturday, July 4, 2026, according to data compiled by KeyData. This performance marked a significant booking period for short-term rentals in the coastal South Carolina region, supported by favorable summer weather and regional Independence Day celebrations.
The high occupancy rate was part of a broader surge in tourism across Horry County and surrounding areas during the holiday weekend. Visitors traveled to the Grand Strand for beach vacations, fireworks, and community events, filling both traditional hotels and vacation rental properties from Little River in the north to Georgetown in the south.
What the data shows
The data released in July 2026 highlighted strong demand across multiple lodging categories on the Grand Strand. In the vacation rental sector, KeyData reported that occupancy on Saturday, July 4, 2026, reached 87.5%. This figure represented a 6% increase compared to the same holiday Saturday in the previous year.
Traditional hotels also experienced high occupancy levels over the holiday period. According to data from CoStar, hotel occupancy on Saturday reached 93.2%, which was an increase of 13.2% compared to the same day last year. The hotel sector also demonstrated stability leading into the holiday, with Friday hotel occupancy holding steady at 92.3%.
The comparison between the two lodging sectors reveals that while both experienced year-over-year growth on Saturday, hotels saw a more pronounced increase of 13.2% compared to the 6% growth recorded for vacation rentals. The high occupancy rates in both categories indicate that the Grand Strand was a highly sought-after destination for the holiday weekend, drawing thousands of visitors to the coast.
How it was measured
The tourism figures were gathered and analyzed by two separate market intelligence organizations. KeyData, which specializes in short-term rental data, measured the occupancy rates for vacation rentals across the Grand Strand. CoStar, a provider of real estate and hospitality marketplace data, measured the occupancy rates for the hotel sector.
The primary source did not publish the specific methodology, sample sizes, or property counts used by KeyData and CoStar to calculate these occupancy percentages. Additionally, the source did not specify the geographic boundaries used to define the Grand Strand market for these measurements, although the region generally encompasses Horry County and Georgetown County, including municipalities such as Myrtle Beach, Little River, and Georgetown.
The data represents occupancy for specific nights during the holiday weekend, specifically Friday, July 3, 2026, and Saturday, July 4, 2026. The source noted that occupancy data for Sunday, July 5, 2026, was expected to be released during the week following the publication of the initial report.
The factors that moved the numbers
Several distinct factors contributed to the high occupancy rates observed over the Fourth of July weekend in 2026. A primary driver was the calendar alignment of the holiday itself. In 2026, the Fourth of July fell on a Saturday, which naturally concentrated leisure travel into a standard weekend block. Tourism officials noted that this calendar placement, combined with favorable weather conditions, encouraged visitors to seek a traditional beach getaway.
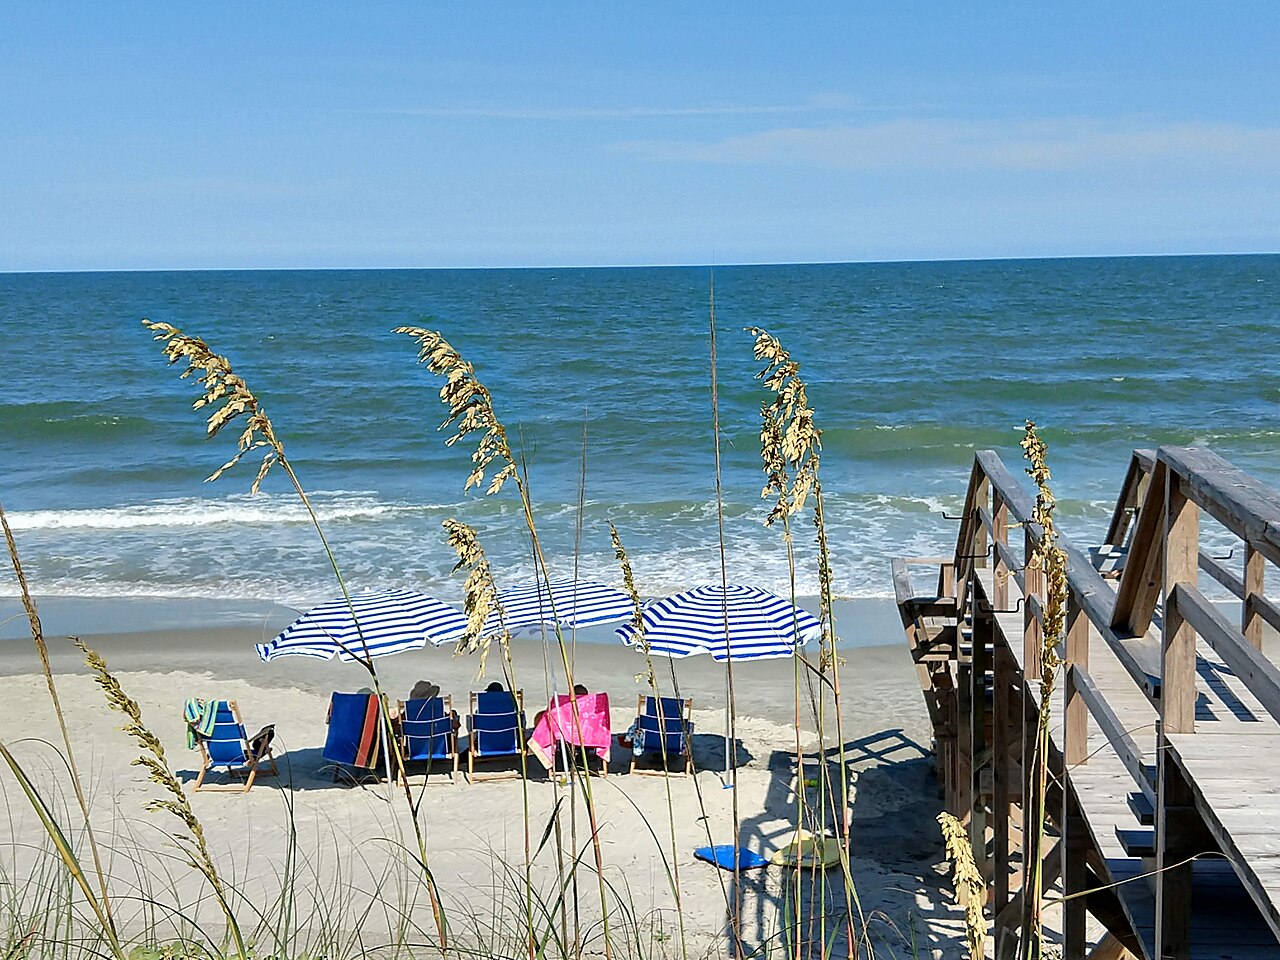
Another key factor was the scheduling of regional events. Tourism officials highlighted that America 250 events, which celebrated the nation's semiquincentennial, played a significant role in attracting visitors to the area. These organized events, along with traditional fireworks displays, parades, and community celebrations, provided strong incentives for families and travelers to choose the Grand Strand.
The data also reflected a shift in traveler behavior. Tourism officials stated that the occupancy figures suggest many visitors planned shorter trips centered specifically around the holiday weekend, rather than arriving earlier in the week. This trend toward shorter, compressed stays helped drive up the occupancy percentages for Friday and Saturday nights, as demand was concentrated into a tighter timeframe.
Who the figures affected
The high occupancy rates directly affected short-term rental hosts, property managers, and hospitality investors operating throughout the Grand Strand. For property managers, an 87.5% occupancy rate on Saturday meant that the vast majority of their managed inventory was occupied, requiring coordinated operational logistics, including cleaning, check-in services, and guest communication.
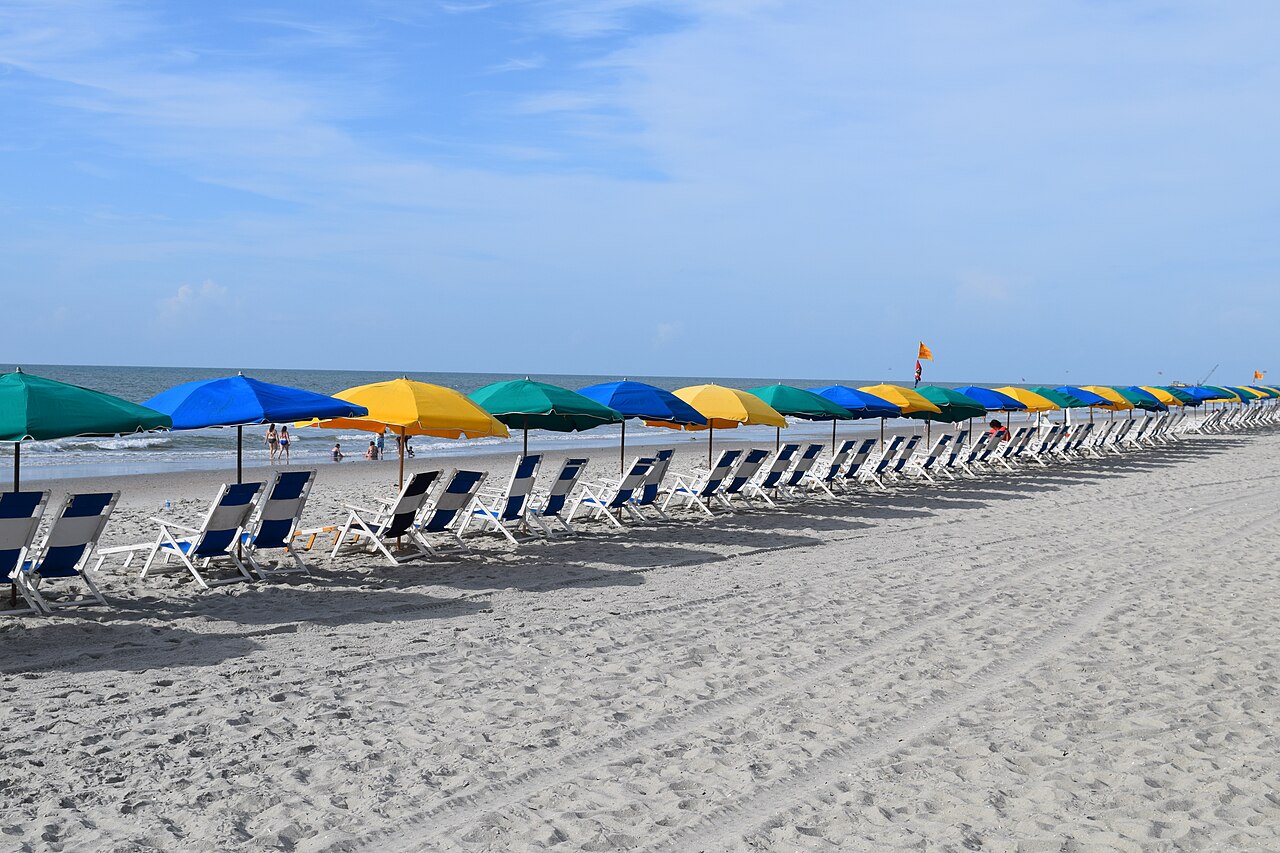
The influx of visitors also had a direct effect on local businesses, attractions, and public infrastructure. Tourism officials reported that beaches, local attractions, and businesses were busy throughout the weekend as residents and visitors participated in community events from Little River to Georgetown. This high volume of foot traffic provided immediate economic support to retail, dining, and entertainment operators in Horry County.
For real estate investors, the year-over-year increases, which included a 6% rise for vacation rentals and a 13.2% rise for hotels, demonstrated the enduring appeal of the Grand Strand as a drive-to holiday destination. The data confirmed that the market retains strong demand during major summer holidays, particularly when favorable weather and national celebrations align.
What the data did not tell you
While the reported occupancy rates indicated a highly successful holiday weekend, there were several critical details that the data did not reveal. First, the figures did not provide a complete picture of the entire holiday week or the broader summer season. Because the report was published on July 10, 2026, it did not include the occupancy data for Sunday, July 5, 2026, which was expected to be released the following week. Without Sunday's data, it was impossible to determine how quickly occupancy declined after the holiday concluded.
Second, the data did not provide any information regarding the financial performance of these properties. The source did not report the average daily rate (ADR) or the revenue per available room (RevPAR) for either vacation rentals or hotels. Consequently, it was unclear whether hosts and hotel operators had to adjust their pricing to achieve these high occupancy levels, or if they were able to command premium holiday rates. High occupancy achieved through heavy discounting can result in lower profitability than moderate occupancy at higher rates.
Third, the report did not specify the total inventory of active listings in the market during the weekend. A 6% increase in vacation rental occupancy could mean different things depending on whether the total supply of short-term rentals on the Grand Strand had grown, shrunk, or remained stable compared to the previous year. If the overall supply of rentals had increased significantly, a 6% rise in occupancy would represent a substantial increase in total bookings; if supply had decreased, the increase in occupancy might simply reflect a smaller pool of available properties.
Finally, the data did not show the average length of stay for the visitors. While officials suggested that visitors planned shorter trips centered around the weekend, the lack of specific booking lead times and stay durations leaves property managers without the precise metrics needed to optimize their booking policies for future holiday weekends.
What to take from it
The occupancy data from the Grand Strand's Fourth of July weekend in 2026 offered valuable insights for short-term rental operators and investors analyzing holiday demand patterns. To apply these findings to individual property management strategies, operators should focus on several key operational and analytical principles.
- Optimize booking policies for calendar alignments: When major holidays fall on a Friday or Saturday, consider shortening minimum-stay requirements to capture the high volume of travelers seeking quick weekend trips.
- Compare performance against local hotel benchmarks: Monitor how local hotel occupancy changes relative to vacation rentals during peak weekends to understand if traditional lodging is capturing a larger share of short-stay demand.
- Track the full holiday booking curve: Look beyond single-day peak occupancy percentages and analyze mid-week demand leading up to and following a major holiday to evaluate true weekly performance.
- Prioritize revenue metrics over occupancy alone: Always analyze average daily rates and revenue per available room alongside occupancy data to ensure that high booking volumes are translating into actual profitability.
Figures checked by the standards desk (Paul Ostrowski): every figure in this story was matched to the source material listed below before publication. The desk's review raised 1 point, corrected before publication.
Sources
- WPDE ABC15 - published July 10, 2026.
Part of the Booked News record for July 2026. The desk filed this story on October 9, 2026 from a source published in the month it covers, under the same figure rule as the daily news.
Report an error in this story · Corrections policy and log

Related stories

KeyData Survey Shows 76.8% of Property Managers Expect Revenue Growth in 2027

U.S. short-term rental revenue paced 26% higher for September 2026, KeyData reported

Short-term rental rates drove $276.7 million World Cup revenue lift in July 2026

New York short-term rental revenue rose 361% during Harry Styles shows in March 2026
Read the desk every morning.
Leave your address for the Booked News briefing: the day's figures on rates, occupancy, demand, fees, supply and returns, each with its source, in one short email.
Comments