Hostfully's U.S. short-term rental Getaway Score fell to 62.0 in September 2026
U.S. consumer sentiment and record-high gas prices dragged the national index down by 2.5 points, but booking demand and a quiet hurricane season offset the decline.

Updated 15 October 2026. After a source check by the standards desk, 2 sentences were removed because no source confirmed their specifics. Corrections log.
On September 6, 2026, Hostfully reported that its monthly U.S. short-term rental Getaway Score fell to 62.0 out of 100 for September 2026, representing a decline of 2.5 points from August 2026 but remaining 12.1 points above September 2025. The index, which tracked seven signals across the vacation rental landscape, reflected a widening gap between declining consumer sentiment and resilient booking activity.
Despite record-high gas prices and a sharp drop in consumer confidence, Americans continued to reserve properties for the Labor Day holiday. The data showed that actual travel behavior, favorable weather, and solid industry pacing counteracted the negative economic vibes felt by consumers, resulting in a slight step back on a much better year-over-year foundation.
What the data shows
In September 2026, the Hostfully Hosting & Travel Index showed a clear divide between consumer sentiment and booking behavior. The national composite score fell to 62.0 out of 100, down from 64.5 in August 2026. This drop was driven by a 16-point decline in the sentiment component and an 8-point drop in the gas prices component.
On the sentiment side, the University of Michigan’s final August Consumer Sentiment reading landed at 51.7, which was a 6.3% one-month decline and 11.2% below the prior year. Additionally, the Conference Board’s consumer confidence index fell to 89.4, its lowest reading in seven months, while its Expectations Index dropped 5.8 points to 68.2. Historically, a widening gap between expectations and current conditions has flagged weaker forward demand. The primary drivers of this decline included inflation worries linked to renewed Middle East tension, a softer labor-market outlook, and high gas prices.
Conversely, booking performance and pricing remained strong. AirDNA reported that July U.S. short-term rental revenue per available room (RevPAR) climbed 7.2% year over year to $217.17, with average daily rates rising in 49 of the 50 largest U.S. markets. HomeToGo reported that search interest for Labor Day 2026 rose 23% year over year, with 90% of searches targeting rural and small-town destinations. Domestic trips accounted for 65% of that demand, up 13.5% year over year.
Travelers also faced higher costs across the board. AAA reported that average domestic airfare for Labor Day was $750, up 2% year over year, while popular-destination airfare averaged $790, up 20% year over year. Domestic hotel rates rose 9% compared to 2025, and international hotels rose 12%. Cruise demand was also strong to destinations like Seattle, Anchorage, and Vancouver, and AAA expected the heaviest road congestion on Thursday and Friday of the holiday weekend.
At the pump, AAA reported a national average gas price of $4.09 on August 27, 2026, up from $3.21 a year earlier. August 2026 was on track to be the most expensive August ever recorded, with every single day of the month averaging above $4. Gas prices in California and Hawaii averaged near $5.50 a gallon. Despite these costs, travelers continued to book road trips, suggesting that drive-market elasticity had changed since 2022.
Weather acted as a major positive driver. NOAA raised the odds of a below-normal hurricane season to 75%, up from 55% in June. Colorado State University projected a final outlook of nine total named storms and one major hurricane.
How it was measured
The Hostfully Hosting & Travel Index was a monthly composite score that tracked the health of the U.S. short-term rental market. The index aggregated seven weighted signals: TSA throughput (20%), Google Trends (20%, tracking search trends), Hostfully platform data (15%), gas prices (15%), lodging consumer price index (10%), consumer sentiment (10%), and weather (10%). Together, these signals produced a single 0-to-100 Getaway Score that indicated market conditions for property managers.
The index covered more than 50 U.S. metropolitan areas and provided monthly city-level and regional scores.
The component breakdown
The movement of the index from 64.5 in August to 62.0 in September was the result of contrasting trends among the seven core signals. The signals split cleanly between negative consumer-facing factors and positive operational factors.
The TSA Throughput component fell from 82 in August to 80 in September, a 2-point decline, reflecting a strong travel pace but a slight seasonal tick down from the July peak. Search Trends fell from 74 to 72, a 2-point decline, as searches shifted toward fall foliage.
Gas Prices fell from 48 to 40, an 8-point decline, due to the $4.09 record August average, which was up 28% year over year. The Sentiment component fell from 58 to 42, a 16-point drop, driven by the University of Michigan reading of 51.7 and the Conference Board’s seven-month low.
On the positive side, Lodging CPI rose from 62 to 66, a 4-point increase, with July CPI at 3.4% year over year and core CPI at 2.5%. Weather rose from 62 to 78, a 16-point increase, due to zero hurricanes through August 30 and NOAA’s 75% below-normal odds. Hostfully Data rose from 65 to 70, a 5-point increase, supported by AirDNA’s July RevPAR rising 7.2% year over year and rates rising in 49 of 50 markets.
Regional performance and city movers
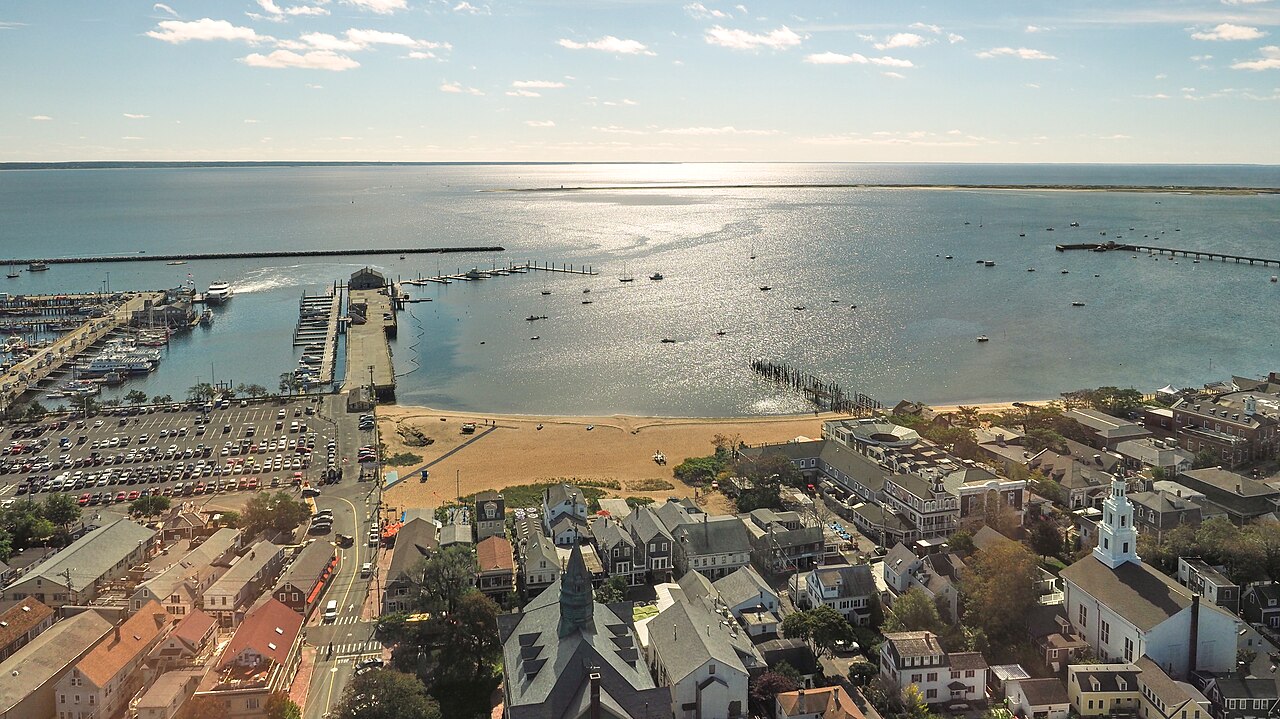
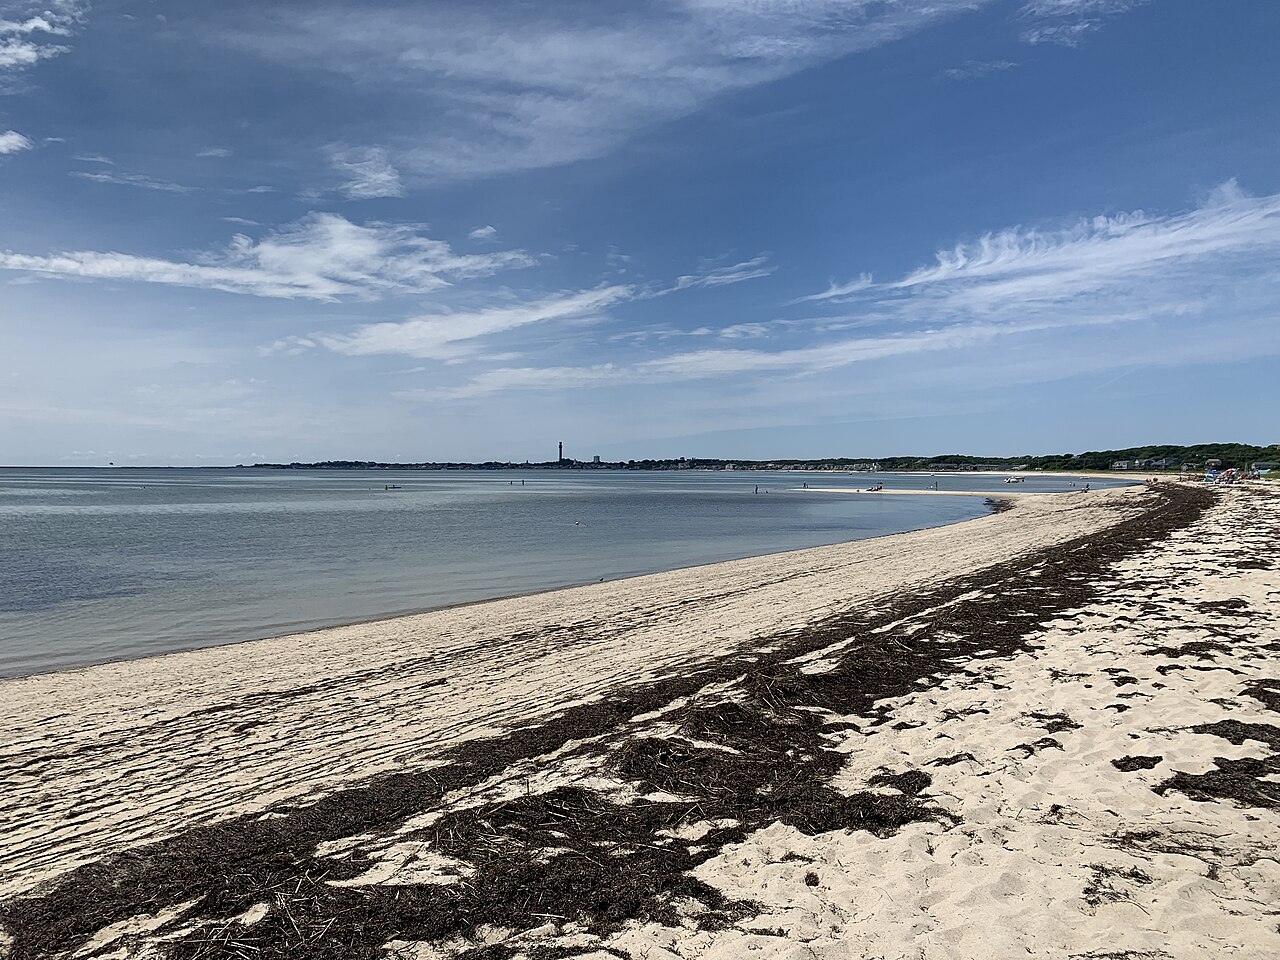
The September 2026 index revealed a significant shift in regional performance. The Northeast region rose 3.0 points to a score of 68.0, overtaking the Southeast to lead the country. This gain was driven by early demand for fall foliage. Bar Harbor, Maine, posted an index score of 84.0, which was the highest single-city reading in the index. Asheville, North Carolina, rose 4.5 points to 82.5 as Blue Ridge foliage searches spiked three weeks earlier than the five-year baseline. Stowe, Vermont, rose 4.0 points, marking its strongest booking pace since 2023. Cape Cod, Massachusetts, slipped 1.5 points to 82.0 as the coastal summer window began to close.
The Southeast region fell 10.0 points to 66.0. While coastal destinations like Destin, Charleston, and Savannah maintained high ratings, Miami, Florida, dropped 18.0 points. This was the single largest one-city decline in the index, influenced by peak hurricane season concerns and high gas prices. Myrtle Beach, South Carolina, also softened, falling 4.0 points on the post-Labor Day pull-forward.
In other regions, the West rose 2.0 points to 60.0, and the Mountain region rose 1.0 point to 58.0, with Sedona, Denver, and Stowe all ticking upward. The Midwest fell 2.0 points to 48.0, crossing back into Cloudy territory due to weaker consumer sentiment and higher exposure to gas prices.
The impact on operators
The disconnect between consumer sentiment surveys and actual booking activity meant that property managers who relied solely on macroeconomic headlines risked underpricing their listings. Hostfully Chief Executive Officer Margot Schmorak noted that operators saw shorter booking windows but stronger conversion rates and high intent.
“August was a mood-versus-money month. The confidence surveys said pull back. The credit card said go anyway. Our operators saw shorter booking windows but stronger conversion, higher intent, and a Labor Day pace that would have made 2019 blush. The lesson is not to dismiss sentiment. It is to trust the booking curve when the two disagree, and to make it easy for a hesitant guest to say yes.”
The data showed that drive-market elasticity changed compared to 2022. Although gas prices remained above $4 per gallon throughout August, travelers did not cancel their trips. Instead, they adjusted their search behavior, with 90% of searches focusing on rural and small-town destinations, particularly in the Northeast, the Rockies, and Appalachia. Guests priced the $4 gas into their travel math, but they favored listings that made non-cost value obvious.
Additionally, the quiet hurricane season in the Atlantic preserved booking supply in coastal markets that typically face disruptions in August. The Southeast index held at 66.0, and beach-market bookings remained stable. However, because peak hurricane activity historically runs from September 10 through October 15, operators in Florida, the Carolinas, and the Gulf Coast remained exposed to late-season storm risks.
What to take from it
The September 2026 index highlights the importance of monitoring actual booking curves rather than relying on general economic sentiment.
- Compare your local booking pace against historical curves rather than reacting to national consumer confidence drops.
- Monitor regional search trends, such as early foliage searches, to adjust seasonal pricing windows ahead of traditional baselines.
- Acknowledge high drive-market costs by highlighting inclusive amenities like free parking, fully equipped kitchens, and laundry facilities in your listings.
- Maintain active storm playbooks and flexible booking policies through October 15, even during unusually quiet hurricane seasons.
- Use weekday incentives and remote-work packages to extend stays and capture demand during the shoulder season.
Figures checked by the standards desk (Paul Ostrowski): every figure in this story was matched to the source material listed below before publication. The desk's review found nothing to correct.
Sources
- Hostfully (Hosting & Travel Index) - published September 6, 2026.
Part of the Booked News record for September 2026. The desk filed this story on October 9, 2026 from a source published in the month it covers, under the same figure rule as the daily news.
Re-checked by the standards desk on 15 October 2026 against the original sources and a public-source lookup: 2 sentences were removed because no source confirmed their specifics.
Report an error in this story · Corrections policy and log

Related stories

U.S. short-term rental RevPAR fell 0.6% in August 2026

U.S. short-term rental rates rose 6.9% in July 2026 as supply growth flattened

U.S. short-term rental RevPAR rose 4.5% in June 2026

U.S. short-term rental occupancy rose to 57.2% in May 2026
Read the desk every morning.
Leave your address for the Booked News briefing: the day's figures on rates, occupancy, demand, fees, supply and returns, each with its source, in one short email.
Comments